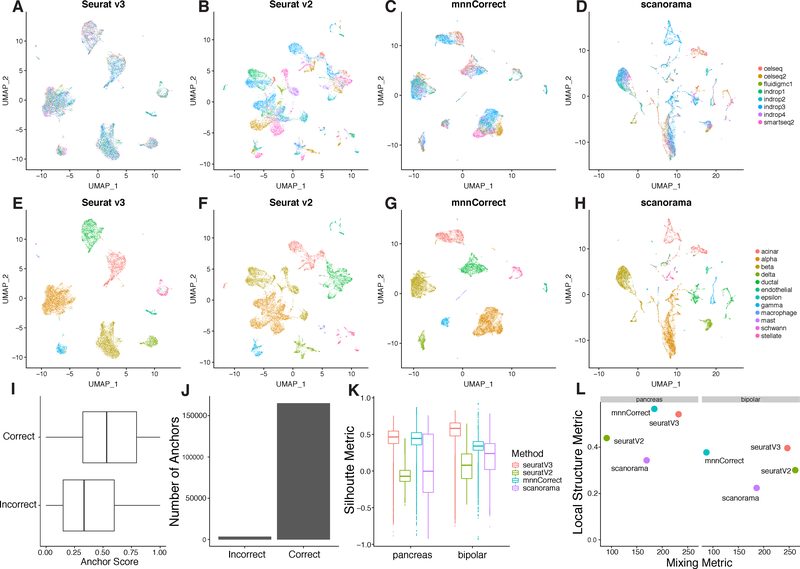
Figure 2. Comparison of multi-dataset integration methods for scRNA-seq.
(A-H) UMAP plots of eight pancreatic islet cell datasets colored by dataset (A-D) and by cell type (E-H) after integration with Seurat v3, Seurat v2, mnnCorrect, and Scanorama. To challenge the methods’ robustness to non-overlapping populations, a single cell type was withheld from each dataset prior to integration. (I-J) Distribution of anchor scores and counts, separated by incorrect (different cell types in the anchor pair) and correct (same cell type in the anchor pair) anchors. Anchors are from the analysis in Figure S1A. (K-L) Metrics for evaluating integration performance across the four methods on two main properties: cell “mixing” across datasets and the preservation of within-dataset local structure (STAR Methods).

