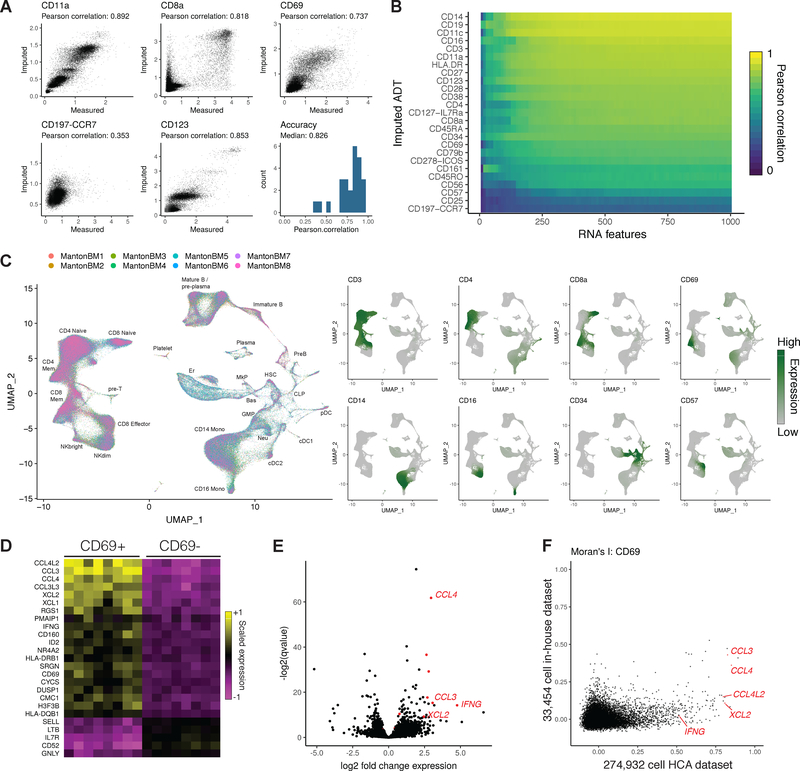
Figure 4. Imputing immunophenotypes in a transcriptomic atlas of the human bone marrow.
(A) Cross-validations for immunophenotype imputation, performed using a CITE-seq dataset of 35,543 bone marrow cells and 25 surface proteins. (B) Prediction accuracy as a function of the number of transcriptomic features used to determine anchors. (C) We integrated 274,932 bone marrow cells produced by the Human Cell Atlas and annotated the cell types. Using the CITE-seq bone marrow cells, we predicted protein expression levels in the integrated HCA dataset, and observed expression patterns consistent with the known cell types. (D) Predicted CD8+ CD69+ cells up-regulate a module of inflammatory cytokines and chemokines across all eight donors. Shown are averaged RNA expression values for each human donor. (E) We validated CD69+ marker genes identified in the scRNA-seq data by performing bulk RNA-seq on FACS-isolated CD8+ CD69+/− cells, which revealed a similar set of deferentially expressed genes. (F) We ordered CD8+ memory cells by their CD69 expression in the HCA and CITE-seq datasets, and computed the autocorrelation for each gene along this CD69 axis (Moran’s I). CD69+ marker genes consistently showed a higher Moran’s I value in the HCA dataset, reflecting the increased statistical power accompanying an order-of-magnitude greater cell number.

