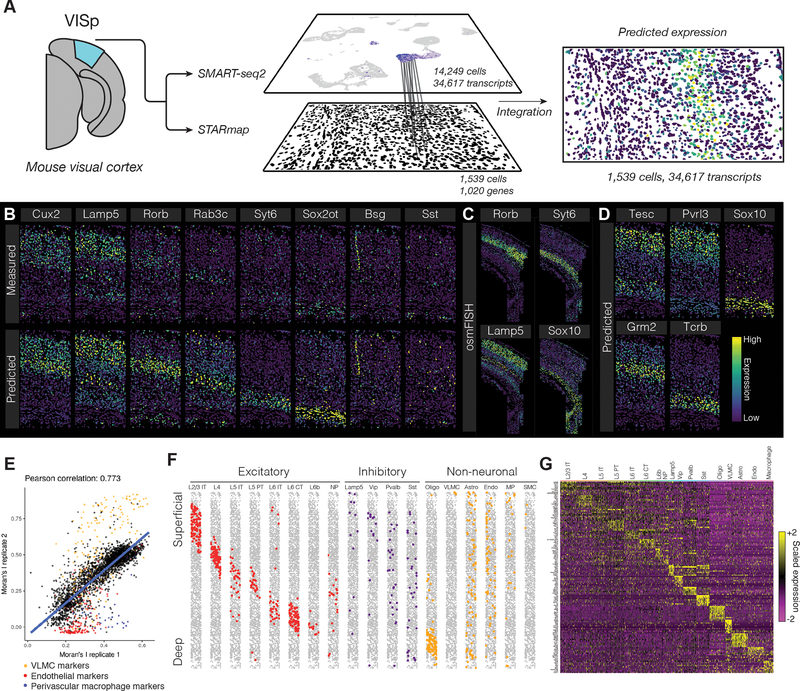
Figure 5. Spatial patterns of gene expression in the mouse brain.
(A) Schematic representation of data transfer between scRNA-seq and STARmap datasets. After identifying anchors using the subset of genes measured in both experiments, we subsequently transfer sequencing data to the STARmap cells, predicting new spatial expression patterns. (B) Leave-one-out cross validation for 8 genes, exhibiting predicted expression patterns, and original STARmap measurements. (C) Gene expression patterns for Rorb, Syt6, Lamp5 and Sox10, as measured by osmFISH, a highly sensitive single molecular assay [Codeluppi et al., 2018], in the mouse somatosensory cortex. (D) Predicted expression patterns for four genes not originally profiled by STARmap, with external validation in Supplementary File 2. (E) Correlation between Moran’s I value, a measure of spatial autocorrelation, for each predicted gene expression pattern in two STARmap replicates. Marker genes for VLMC cells, endothelial cells, and perivascular macrophages are highlighted, reflecting rare cell subsets that were spatially restricted in only one replicate. (F) Horizontally-compressed STARmap cells with predicted cell type transferred from the SMART-seq2 dataset. (G) Expression of cell type marker genes in each predicted STARmap cell type (both replicates combined).

