
Figure 3.
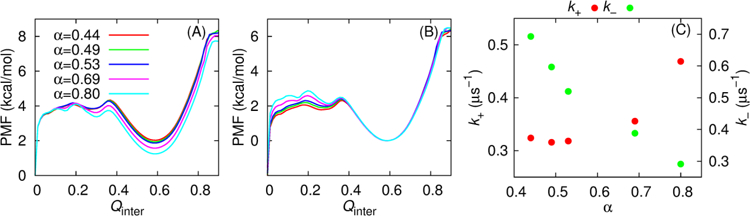
(A) Potential of mean force (PMF) as a function of Qinter at 314 K for five NCBD/ACTR models. These profiles were obtained from MD production simulations and calculated as −RTln[P(Qinter)], where P(Qinter) is the probability distribution of Qinter, T is the temperature, and R is the gas constant. All traces have been shifted such that the free energy value at Qinter=0 is zero. (B) Same as (A) except that all traces have been shifted that free energy value at Qinter=0.58 is zero. (C) Association and dissociation rates as a function of the H1 helicity of unbound ACTR.