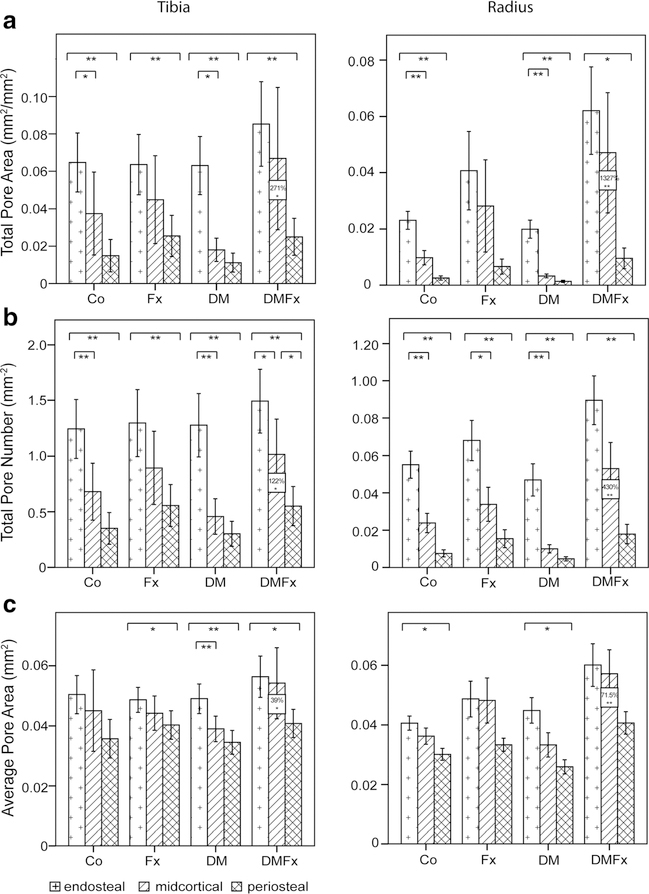
Fig. 1.
Results of laminar cortical analysis by cortical layer, group, and by skeletal site. Results for the distal tibia are displayed on the left; results for the distal radius are shown on the right. Co controls, Fx women with history of fragility fractures, DM type 2 diabetic (T2D) women without fractures, DMFx T2D women with history of fragility fractures. Bars indicate differences between layers; boxed values indicate significant differences between DMFx and DM groups. **p ≤ 0.001, *p ≤ 0.05

