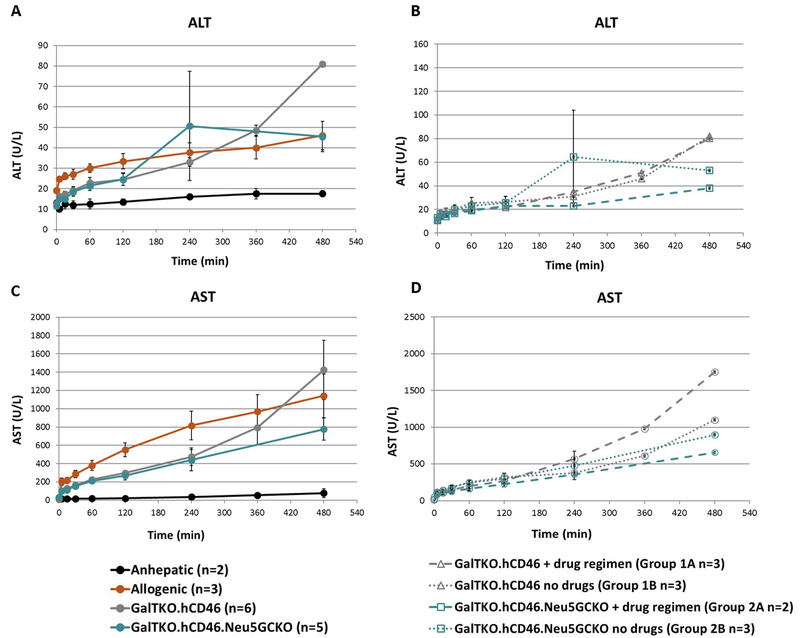
Figure 3: Transaminase elaboration.
A. Measured ALT values comparing GalTKO.hCD46 and GalTKO.hCD46.Neu5GcKO livers to anhepatic controls. ALT levels in all experiments were within the normal range and there was no significant difference in ALT values between the two xenogeneic groups. B. Subgroup analysis of ALT values within xenogeneic experiments based on addition of drug regimen. Within the GalTKO.hCD46 group there was no difference based on drug regimen (Groups 1A and 1B) and within the GalTKO.hCD46.Neu5GcKO group where was no difference based on drug regimen (Groups 2A and 2B). C. AST levels rose well above normal range in all xenogeneic experiments. D. Subgroup analysis of AST values within xenogeneic experiments based on addition of drug regimen. Within the GalTKO.hCD46 group there was no difference based on drug regimen (Groups 1A and 1B) and within the GalTKO.hCD46.Neu5GcKO group where was also no difference based on drug regimen (Groups 2A and 2B). Of note due to different perfusion lengths standard error could not be calculated after 4 hours.

