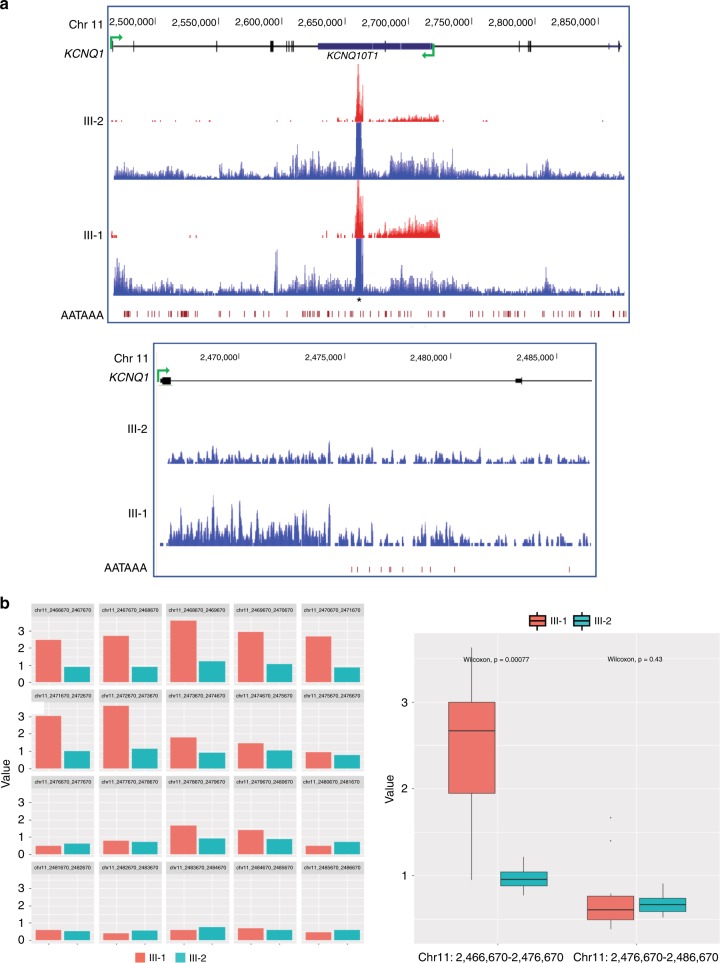
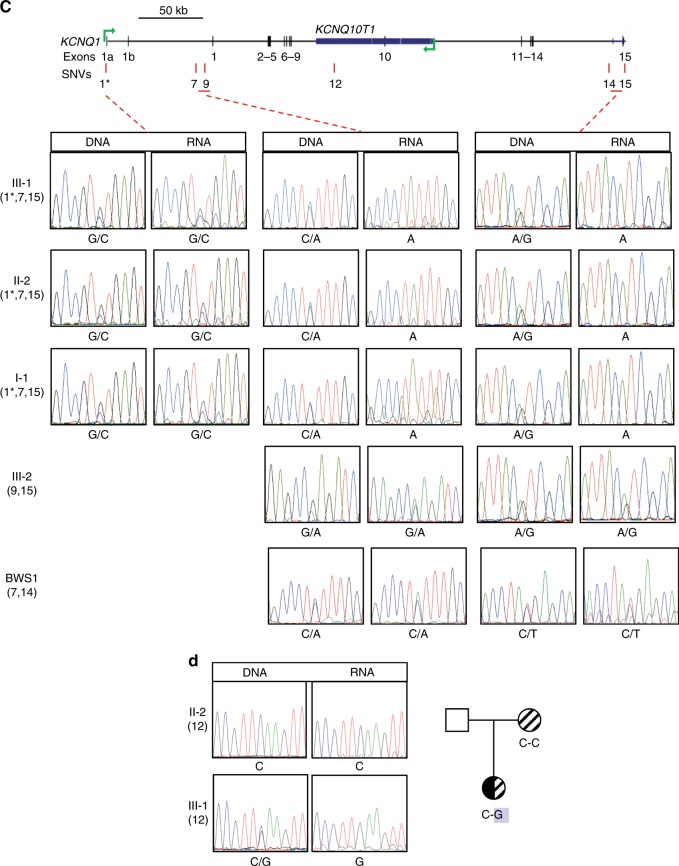
Fig. 3.
Effect of the splice-site variant on KCNQ1 expression. (a) Transcription profile of KCNQ1 in III-1 and III-2 obtained by RNAseq on total RNA from blood leukocytes. Top: screenshot from University of California–Santa Cruz (UCSC) Genome Browser showing the RNA transcribed from the positive (blue) and negative (red) strands of the KCNQ1 locus. A track showing the location of AATAAA poly-A addition sites is reported below the RNA tracks. The peak of reads on both strands in the middle of the gene (indicated by an asterisk) corresponds to an L1 repeat. Bottom: zoom in of the first 5’ 20 kb of KCNQ1. (b) Observed increased expression of the most 5’ 10 kb of KCNQ1 in the proband (III-1) compared with her sister (III-2). Expression profile of the most 5’ 20 kb (2466670-2486670) represented as normalized read count partitioned in windows of 1 kb (bar plots on the left) or normalized read count distribution in two windows of 10 kb (box plots on the right) of III-1 and III-2. Y-axis values in bar plots are absolute counts in millions normalized by the number of uniquely mapped reads. Box plots show a statistically significant enrichment of the coverage in the first 10 kb (2466670-2476670) of III-1 compared with III-2, but similar coverages in the following 10 kb (2476670-2486670). (c) Allele-specific expression analysis of KCNQ1 in III-1, II-2, I-1, and III-2 of family 2 and an unrelated Beckwith–Wiedemann syndrome (BWS) case with IC2 loss of methylation (LOM), analyzed as in Fig. 1f. A schematic diagram of KCNQ1 is reported at the top to indicate the positions of the analyzed single-nucleotide variants (SNVs) (red vertical lines). SNV codes are listed in Table S2. The electropherograms are organized in three panels corresponding to SNVs located in different parts of the KCNQ1 gene. The numbers in parentheses at the left of the electropherograms represent the SNVs analyzed in each individual. The splice-site variant described in Fig. 2c is indicated by an asterisk. (d) Allele-specific expression analysis of KCNQ1 to determine the parental origin of the transcribed allele in III-1. The typed SNV (SNV12 = rs7942590 G/C) falls in the part of the KCNQ1 gene that is expressed from only one allele. The boxed G represents the only allele present in the RNA of III-1.


