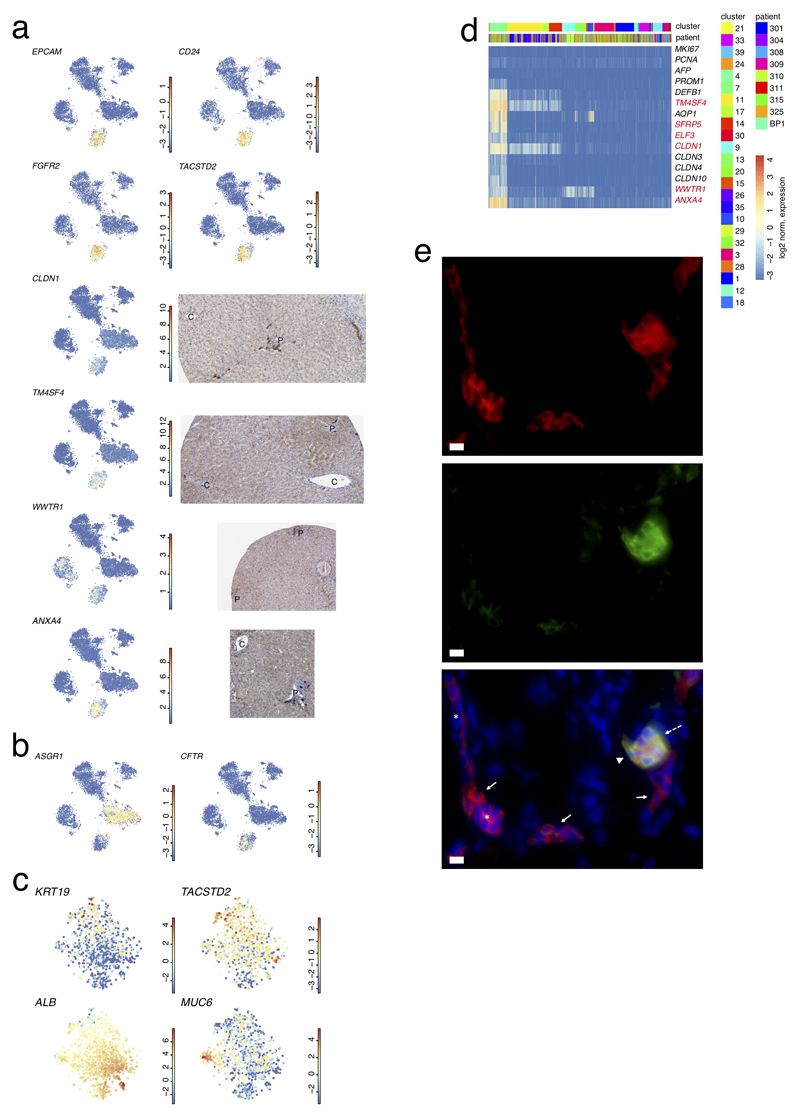
Extended Data Figure 7. ScRNA-Seq reveals novel marker genes expressed by EPCAM+ cells.
a, Expression t-SNE maps (left) for EPCAM, CD24, FGFR2, TACSTD2, CLDN1, TM4SF4, WWTR1, and ANXA4 (n=10,372 cells) and immunohistochemistry from the Human Protein Atlas (right) for CLDN1, TM4SF4, WWTR1, and ANXA4. The color bar in the expression t-SNE maps indicates log2 normalized expression. b, Expression t-SNE maps for ASGR1 and CFTR (n=10,372 cells). The color bar in the expression t-SNE maps indicates log2 normalized expression. c, t-SNE maps showing expression of KRT19, ALB, TACSTD2 and MUC6 expression in the EPCAM+ compartment (n=1,087 cells). The color bar indicates log2 normalized expression. d, Expression heatmap of proliferation markers (MKI67, PCNA), AFP, and identified markers of the EPCAM+ compartment. Genes highlighted in red correspond to newly identified markers of the EPCAM+ compartment. The heatmap comprises all clusters to show the specificity of the markers for the progenitor compartment. The expression analysis confirms the absence of proliferating and AFP+ cells. e, Immunofluorescence labeling of EPCAM and KRT19 on human liver tissue. EPCAM+KRT19low/- (solid arrow) in the canals of Hering (*) and EPCAM+KRT19+ (broken arrow) cells in the biliary duct (arrowhead) are indicated. Nuclei are stained with DAPI. scale bar, 10μm (n=3 independent experiments).

