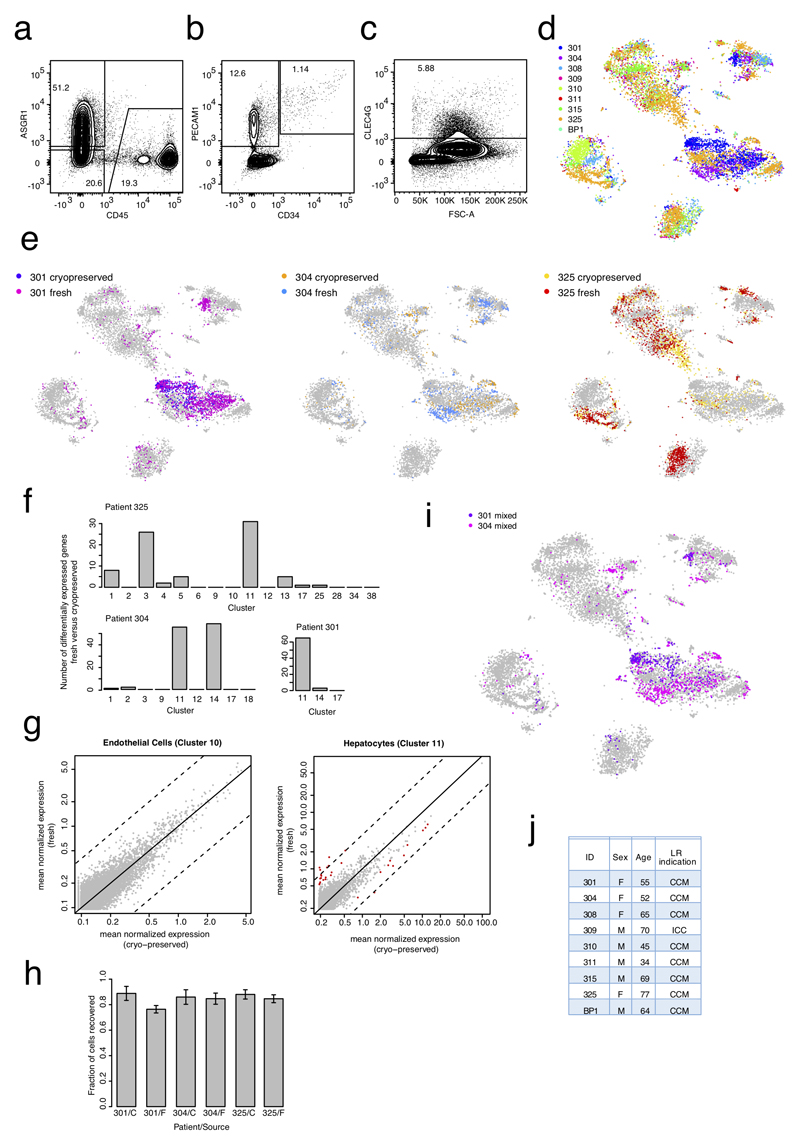
Extended Data Figure 1. ScRNA-seq analysis of normal liver resection specimens from nine adult patients.
a, FACS plot for CD45 and ASGR1 staining from a mixed fraction (hepatocyte and non-parenchymal cells). b, FACS plot for PECAM1 and CD34 staining from a mixed fraction. c, FACS plot for CLEC4G staining from a mixed fraction. (a-c) n=6 independent experiments. d, t-SNE map showing the IDs of the 9 patients from which the cells were sequenced. Cells were sequenced from freshly prepared single-cell suspensions for patients 301, 304, 325, and BP1, and from cryopreserved single-cell suspensions for patients 301, 304, 308, 309, 310, 311, 315, and 325. Cells were sorted and sequenced mainly in an unbiased fashion from non-parenchymal cell, hepatocyte and mixed fractions of patients 301 and 304. Non-parenchymal and mixed fractions were used to sort specific populations on the basis of markers. CD45- and CD45+ positive cells were sorted from all patients. CLEC4G+ LSECs were sorted by FACS from patients 308, 310, 315, and 325. EPCAM+ cells were sorted by FACS from patients 308, 309, 310, 311, 315, and 325. e, t-SNE map highlighting data for fresh and cryopreserved cells from patients 301, 304 and 325. Although minor shifts of frequencies within cell populations are visible, transcriptomes of fresh and cryopreserved cells co-cluster. Differential gene expression analysis of fresh versus cryopreserved cells, e.g. for endothelial cells of patient 325 in cluster 10 (f), did not reveal any differentially expressed genes. (d,e) n=10,372 cells. f, Barplot showing the number of differentially expressed genes (Benjamini-Hochberg corrected P<0.01; Methods) between fresh and cryopreserved cells within each cluster for patient 325 (upper panel; n=2,248 cells) and patients 304 (n=959 cells) and 301 (n=1,329 cells) (lower panel). Only clusters with >5 cells from fresh and cryopreserved samples were included for the computation. g, Scatter plot of mean normalized expression across fresh and cryopreserved cells from patient 325 in endothelial cells of cluster 10 (no differentially expressed genes, left) (n= 101 cells) and cluster 11 (maximal number of differentially expressed genes across all clusters, right) (n=272 cells). Red dots indicate differentially expressed genes (Benjamini-Hochberg corrected P<0.01; Methods). Diagonal (solid black line) and log2 fold changes of four (broken black lines) are indicated. Almost all differentially expressed genes for cluster 11 exhibit log2-foldchanges < 4. h, Barplot showing the fraction of sorted cells which passed quality filtering (see Methods) after scRNA-seq. Error bars are derived from the sampling error assuming binomial counting statistics. F, fresh samples; C, cryopreserved samples. i, t-SNE map highlighting cells sequenced from mixed plates representing unbiased samples for patient 301 and 304. Without any enrichment strategy, hepatocytes and immune cells strongly dominate and endothelial cells as well as EPCAM+ cells are rarely sequenced. j, Table of patient information. CCM: colon cancer metastasis; ICC: intrahepatic cholangiocarcinoma; LR: liver resection.

