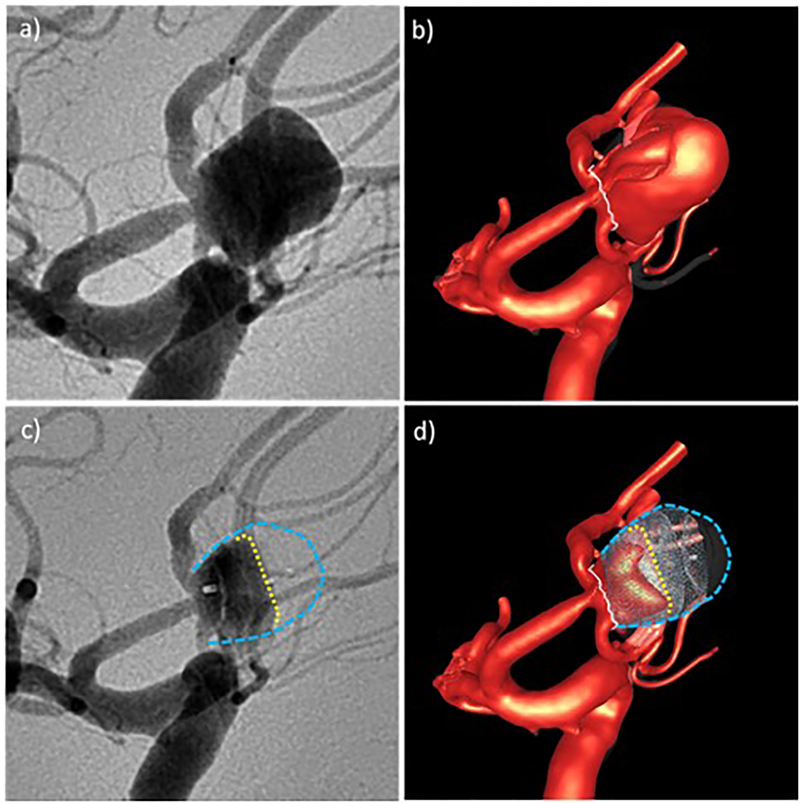
Figure 6:
Qualitative comparison of CFD results and in vivo DSA angiograms before and after treatment for aneurysm 2: a) pre-treatment DSA, b) high speed flow before treatment, c) post-treatment DSA – yellow line indicates region of higher contrast agent concentration towards the aneurysm inflow zone, d) high speed flow after treatment – yellow line indicates region of persistent high speed flow. Blue lines delineate the aneurysm wall.

