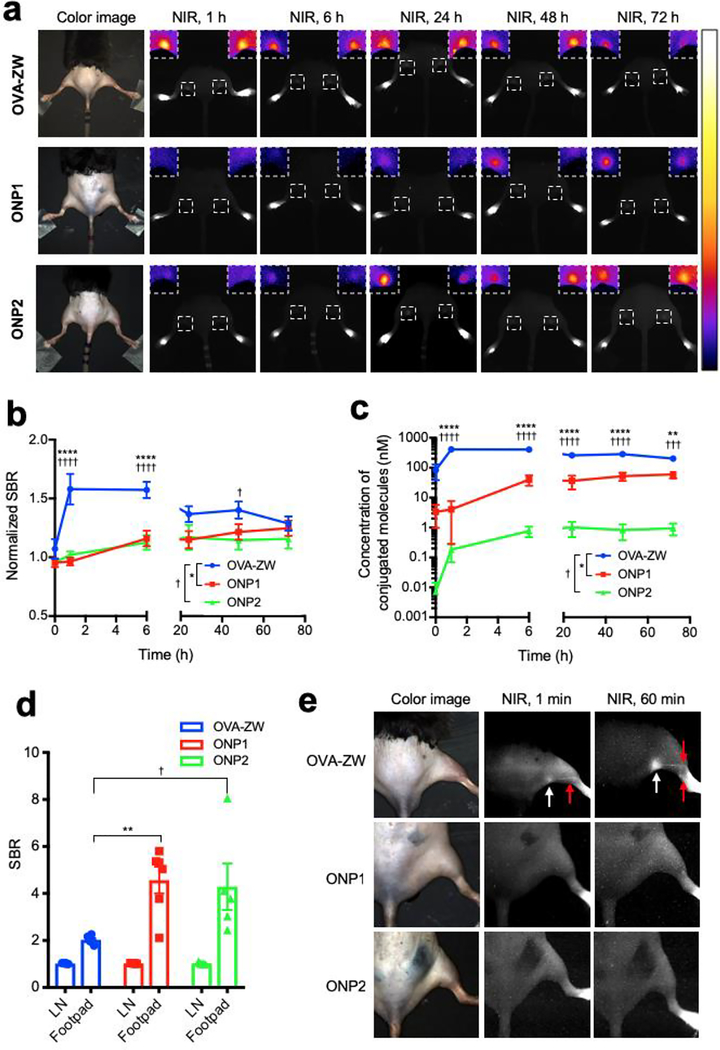
Figure 2.
Quantitative image analysis of vaccine trafficking in the draining LNs. Trafficking of the model vaccines into draining LNs was monitored on the FLARE system and evaluated by image analysis. a) Representative images of mice 0, 1, 6, 24, 48 and 72 h post-injection with model vaccines. Insets show magnified pseudocolor images of popliteal LNs. b) The SBR of popliteal LNs was calculated by comparing with background skin signals (n = 4, mean ± SEM.). c) Quantitative tissue concentrations of model vaccines in the popliteal LNs. SBRs was converted to concentrations based on the labeling ratio (n = 4, mean ± SEM.). d) The SBR of LNs and injection site was compared (n = 5–6, mean ± SEM.). e) Representative LN images injected with model vaccines 1 min and 60 min prior to imaging. b-d) A P value of less than 0.05 was considered significant: *P < 0.05; **P < 0.01; ***P < 0.001; ****P < 0.0001 by one-way ANOVA followed by Tukey’s multiple comparisons test. FLARE, Fluorescence-Assisted Resection and Exploration; SBR, signal-to-background ratio.

