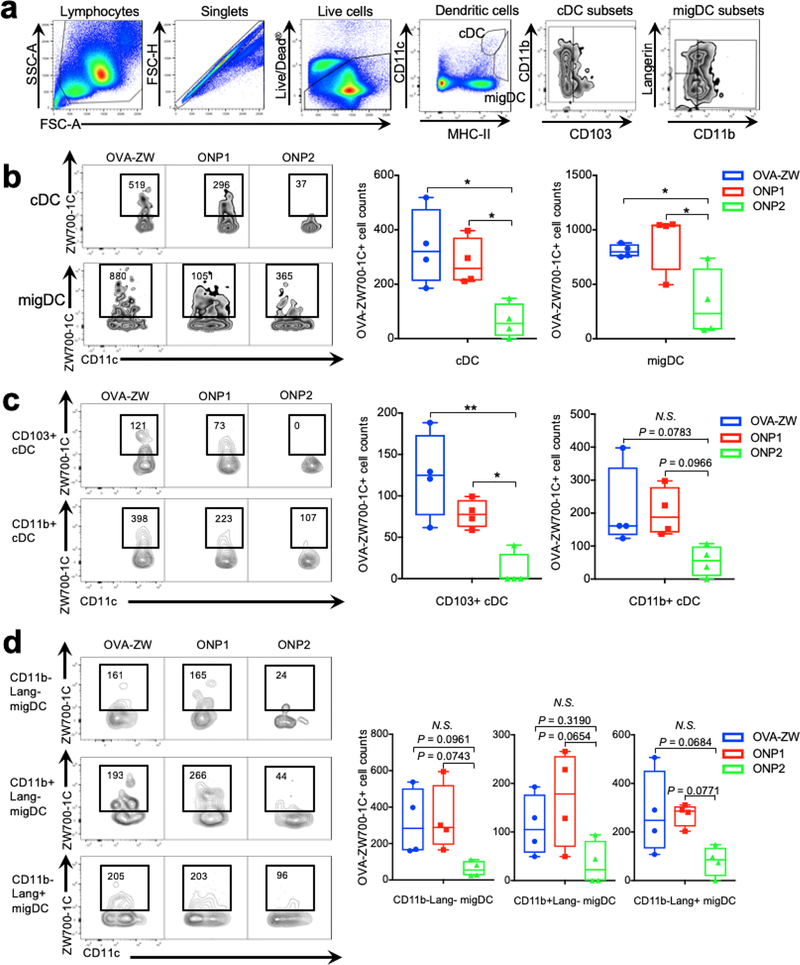
Figure 4.
Flow cytometry analysis of vaccine uptake by DCs. Uptake of the model vaccines in DCs in the drainage LNs was assessed by flow cytometry 72 h post-intradermal injection of model vaccines (n = 4, median ± 95% confidence interval). a) Gating schematic to identify DC subsets within LNs. b) Cell counts of OVA-ZW positive classical LN resident DCs (cDCs) and migatory DCs (migDCs). c) Cell counts of cDC subsets. d) migDC subsets in the draining LNs. b-d) A P value of less than 0.05 was considered significant: *P < 0.05; **P < 0.01, N.S.: not significant by one-way ANOVA followed by Tukey’s multiple comparison test.

