Figure 5.
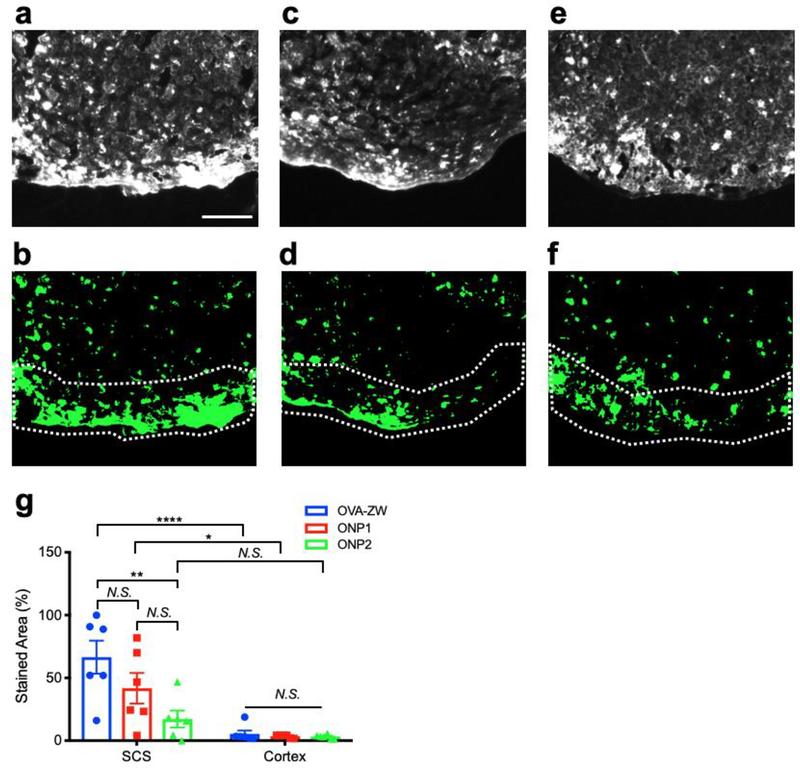
Histological analysis of vaccine uptake by APCs in the draining LNs. Uptake of the model vaccines in APCs was assessed by histology 72 h post-intradermal injection. a–c) Representative fluorescence images. d–f) binarized images of LNs: (a,b) OVA-ZW, (c,d) ONP1, (e,f) ONP2. Dotted lines depict capsule and subcapsular sinus (SCS) of LNs. Scale bar = 100 μm. g) Quantitative analysis of areas positive for fluorescence in SCS and cortex of LNs injection (n = 6, mean ± SEM.). A P value of less than 0.05 was considered significant: *P < 0.05; **P < 0.01; ****P < 0.0001; N.S., not significant by two-way ANOVA followed by Tukey’s multiple comparison test.

