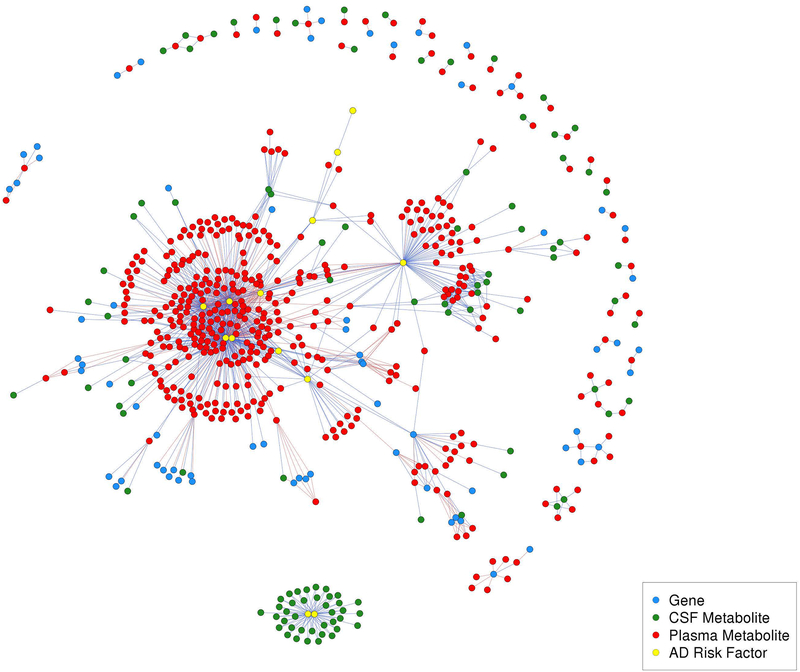
Figure 2.
Inter-omic network. This network has 1,224 edges and 635 nodes, which included 171 metabolite-gene edges, 833 metabolite-AD risk factor edges. Of these, 73 were CSF metabolite-AD risk factor edges (CSF T-tau and P-tau, exclusively) and 4 were CSF metabolite-gene edges. Red edges indicate negative correlations and blue edges indicate positive correlations.

