
Figure 4. PAG-USV neuronal activity gates USVs and specifies vocal bout duration.
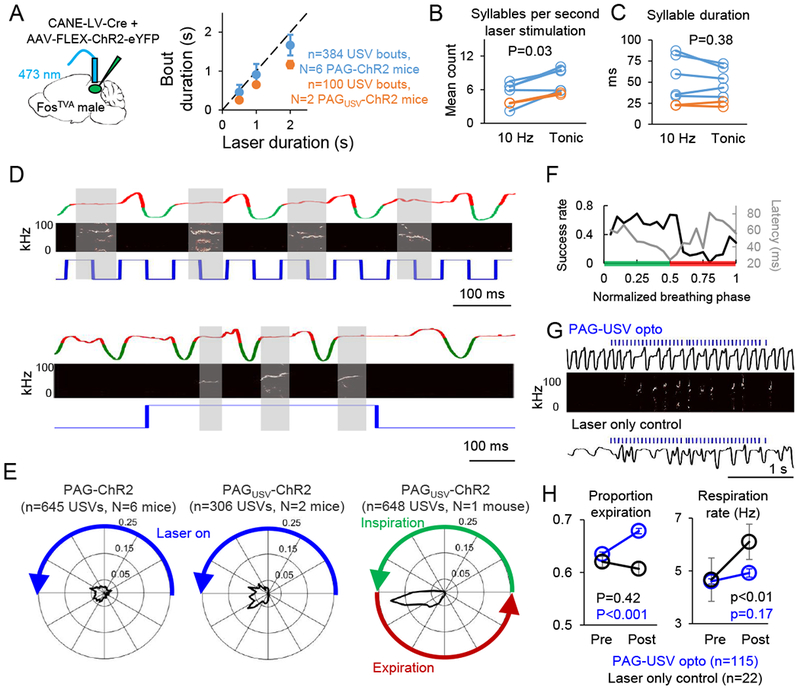
(A) (Left) Schematic of the viruses injected into the caudolateral PAG of a FosTVA male to express ChR2 in PAG-USV neurons. (Right) The duration of optogenetically-elicited bouts of USVs is similar to the duration of laser stimuli used to activate PAG-USV neurons (mean ± SE).(B) Comparison of the number of USV syllables elicited per second of laser stimulation is shown for 10 Hz versus tonic laser stimuli for PAG-ChR2 mice (blue) and PAGUSV-ChR2 mice (orange; p = 0.03 for difference, Wilcoxon signed-rank test). (C) Same as (B), except comparing mean syllable duration for optogenetically-elicited USVs optogenetically (p = 0.38). (D) Representative portions of two bouts of optogenetically-elicited USVs are shown for a PAGUSV-ChR2 mouse, with breathing shown in the top traces (inspirations are downward deflections in green, expiration is shown in red, see Methods), USVs shown in the spectrograms (middle), and laser stimuli shown in blue (bottom). Gray shading shows the clear alignment between USVs and expiration. (E) (Left, middle) Polar plots showing the distribution of onset times of individual optogenetically-elicited USV syllables relative to the duty cycle of the preceding laser pulse (10 Hz, 50ms on and 50ms off) for PAG-ChR2 mice (left) and PAGUSV-ChR2 mice (middle). Blue line indicates the laser-on portion of the laser duty cycle. Radial values (ranging from 0 to 0.25) represent proportion of total observations at a given time in the laser duty cycle, and total area inside the shaded black line is equal to one. (Right) Polar plot showing the distribution of onset times of individual optogenetically-elicited USV syllables relative to the respiratory cycle. (F) The probability of obtaining an optogenetically-elicited USV (black) and the mean latency from laser onset to USV onset (gray) are plotted in relation to the time that each laser pulse fell within the respiratory cycle (see Methods; green shading indicates inspiration, red shading indicates expiration, n = 1051 laser pulses from N = 1 PAGUSV-ChR2 mouse). (G) Breathing traces are shown for a PAGUSV-ChR2 mouse during optogenetic activation of PAG-USV neurons (top, breathing shown in black, laser in blue, USVs in spectrogram) and during a control period in which the laser was turned on but was disconnected from the optogenetic ferrule (bottom; breathing, black; laser, blue). (H) Optogenetic activation of PAG-USV neurons caused a significant increase in the proportion of the respiratory cycle occupied by expiration (left, blue, p < 0.001, Wilcoxon signed-rank test) and no change in respiration rate (right, blue). When the laser was not connected to the ferrule, laser light alone did not change the expiration/inspiration ratio (left, black, p = 0.42) and caused a significant increase in breathing rate (right, black, p < 0.01), likely due to a startle response (mean ± SE).