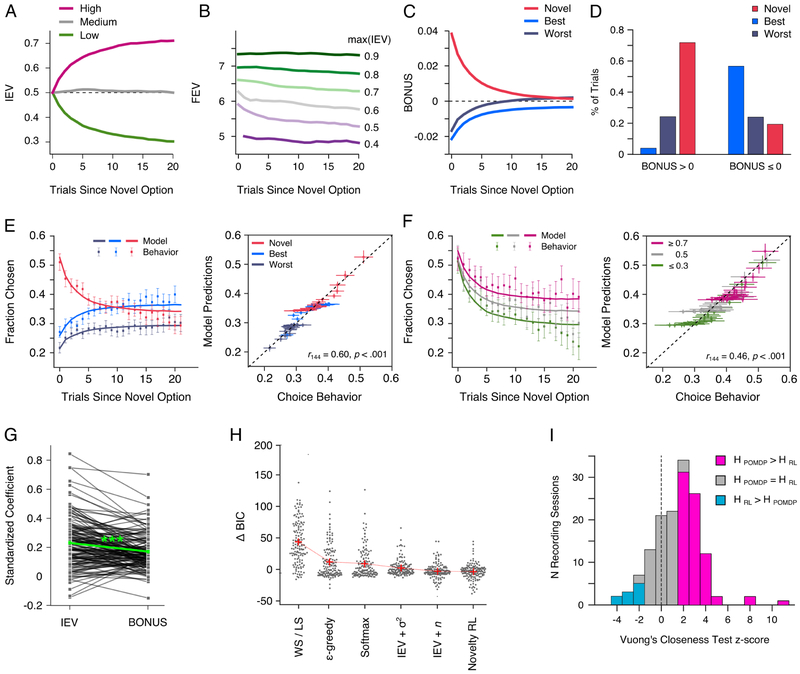
Figure 2. Computational modeling of explore-exploit decisions using a POMDP.
(A) Mean trial by trial changes in the IEV of novel options assigned different reward values (B) Mean trial by trial changes in the FEV, averaged across all three options, as a function of the maximum available IEV. (C) Mean trial by trial changes in the exploration BONUS for each option type (see Fig. S2 for detailed examples) (D) How often the monkeys chose each option type when the exploration BONUS was positive or negative in value. (E and F) The correlation between POMDP model predictions and actual choices based on the option type chosen, E, and the a priori reward probability assigned to each option, F. (G) Parameter estimates used to weight the IEV and exploration BONUS value of chosen and unchosen options in the fitted POMDP model (Table S1). (H) The difference in BIC between alternative choice models and the POMDP model (see STAR Methods and Table S1). (G) Histogram of the number of sessions in which the POMDP model (HPOMDP) better predicted monkeys’ choices than the RL model that incorporated a fixed novelty bonus (HRL).

