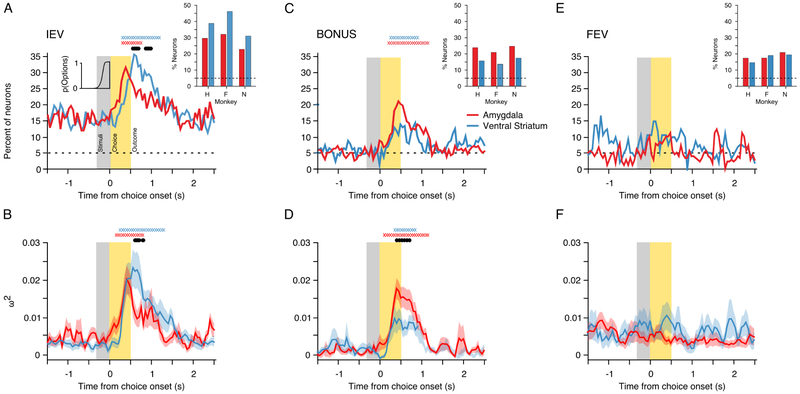
Figure 4. Population encoding of POMDP derived value signals.
(A) Percentage of task responsive neurons in each region that encoded the IEV of the chosen option. The inset histogram indicates the cumulative RT distribution, averaged across sessions. The inset bar plot indicates the percentage of neurons in each monkey that encoded the IEV of the chosen option, ± 250 ms from the trial outcome. (B) Mean effect size (ω2) in neurons that encoded the IEV of the chosen option in each region. (C and D) Same as A and B for encoding of the exploration BONUS for the chosen option. (E and D) Same as A and B for encoding of the FEV of the chosen option. If present, the X symbols at the top of each panel indicate for each region the time bins where encoding exceeded baseline, while the black symbols indicate a significant difference between the amygdala and ventral striatum (both FWE cluster corrected at p<.05).

