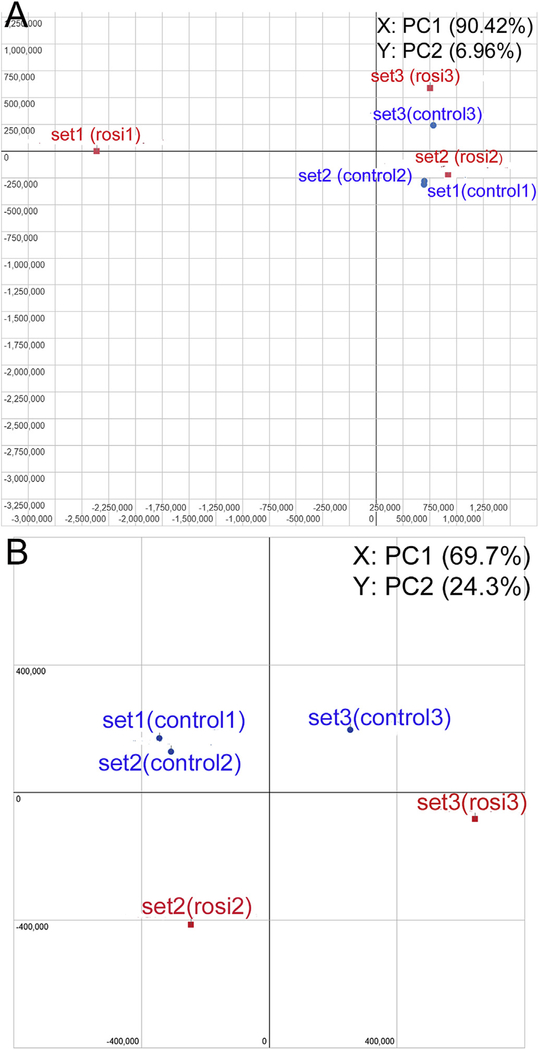
Fig. 1.
PCA (principal component analysis) plot conducted on the normalized gene expression values of the samples. X- and Y-axes show the PC1 and PC2, respectively, with the amount of variance explained by each component reported in parenthesis. Blue dots in the plot represent replicates of control and red dots are rosiglitazone treated samples. (A) PCA plot of all 6 samples. (B) A new PCA plot generated after excluding 1 outlier.

