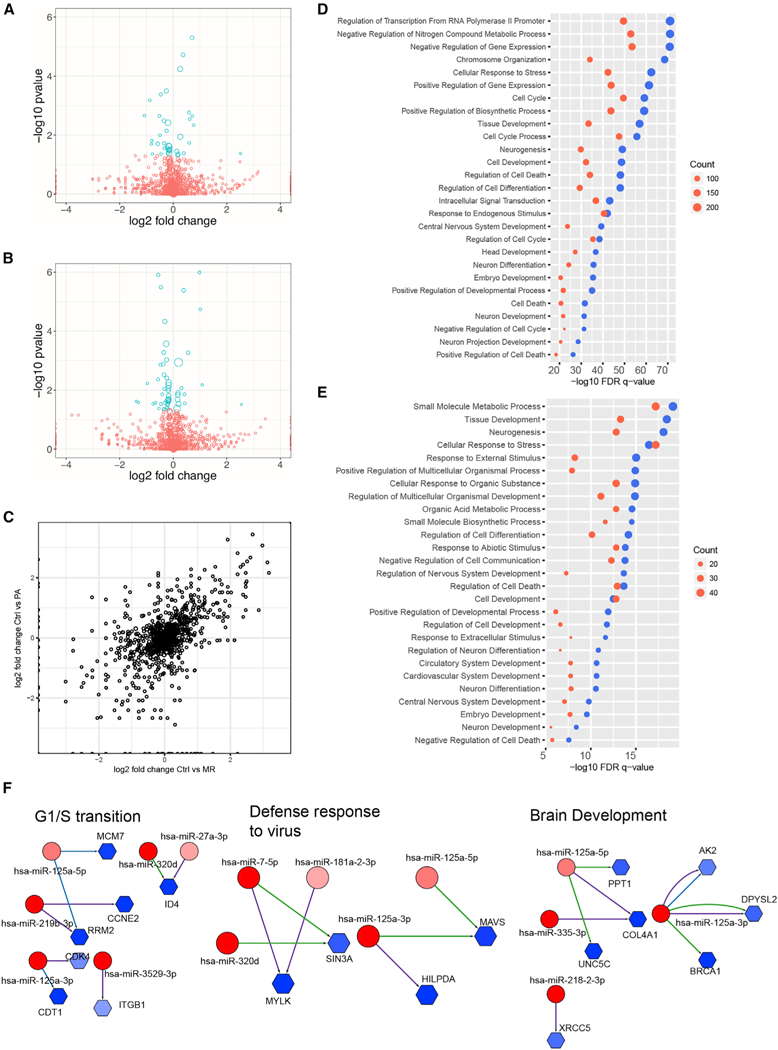
Figure 2. Relationship between Differentially Expressed miRNAs and Putative mRNA Targets in ZIKV-Infected hNSCs.

(A and B) Volcano plots of differentially expressed miRNAs in (A) MR766- and (B) Paraiba-infected hNSCs at 3 days post-infection. Blue circles represent significantly (adjusted p < 0.05) differentially expressed miRNAs. The size of each circle is proportional to the square root of the base mean expression of the gene.
(C) Comparative dot plot of differentially expressed miRNAs in MR766 (MR)- and Paraiba (PA)-infected hNSCs. The size of each circle is proportional to the square root of the base mean expression of the gene.
(D and E) Gene set enrichment analyses (GSEAs) of putative miRNA targets differentially expressed in hNSCs during MR766 (D) and Paraiba (E) infection. Blue represents downregulated mRNAs targeted by upregulated miRNAs; red represents upregulated mRNAs targeted by downregulated miRNAs. The size of the dot is proportional to the number of genes in that enriched GSEA biological category.
(F) Integrative regulatory network analyses showing upregulated miRNAs (red circles) targeting downregulated putative mRNA targets (blue hexagons) based on TargetScan, miRANDA, and miRTarBase. The number of edges between miRNAs and mRNAs is equal to the number of algorithms predicting the miR-mRNA interaction. The blue or red color intensity is proportional to the fold change in expression during ZIKV infection (darker represents larger change).
See also Figure S2.
