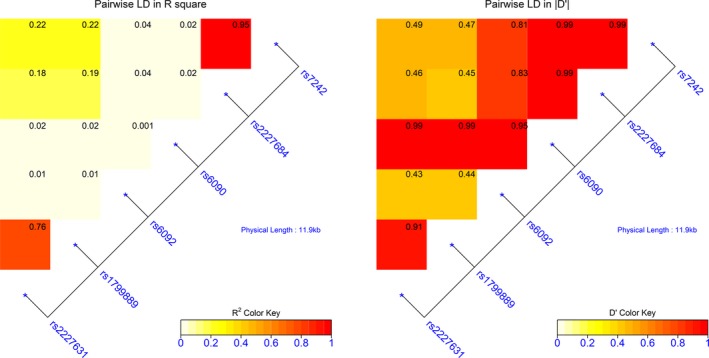
Figure 1.

LD map showing block structure across the SERPINE1 gene. Heat map color keys indicate the degree of R2 and D' and the number in each block indicate the calculated R2 and D'. The LD map is constructed with LDMAP package in R statistical environment
