Figure 2.

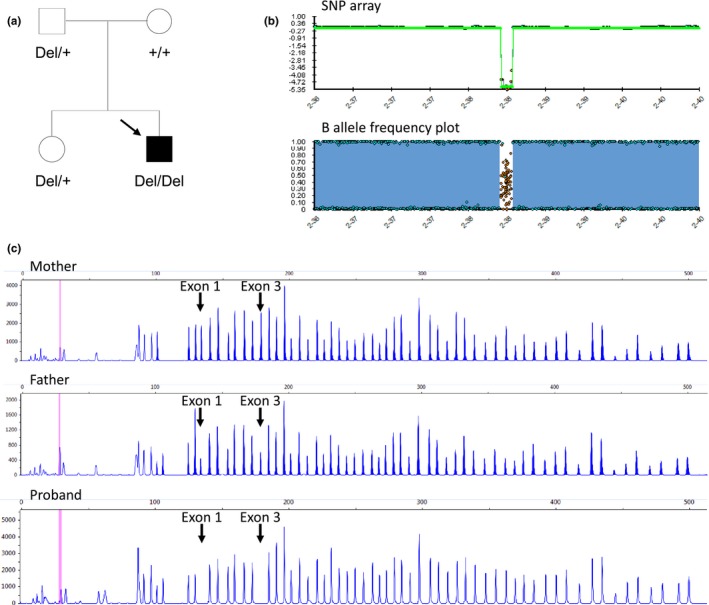
Pedigree and genetic analysis. (a) Pedigree of the family. The solid symbol indicates primary congenital glaucoma, the CYP1B1 deletion is represented by “Del” and the wild type allele by the “+’ sign. (b) Single nucleotide polymorphism (SNP) array confirming the homozygous CYP1B1 deletion (top panel) and B allele frequency plot showing complete homozygosity on chromosome 2, corresponding to uniparental isodisomy (bottom panel). The B allele frequency is a normalized measure of the allele frequency ratio of the two alleles: values of 0 or 1 indicate areas of homozygosity, whereas a value of 0.5 indicates areas of heterozygosity. (c) MLPA analysis showing normal CYP1B1 copy number in the proband's mother (upper panel), heterozygous CYP1B1 deletion in the proband's father (middle panel) and homozygous CYP1B1 deletion in the proband (bottom panel). The arrows show the two probes in exons 1 and 3, while the other peaks represent unrelated probes to other genes used as internal controls
