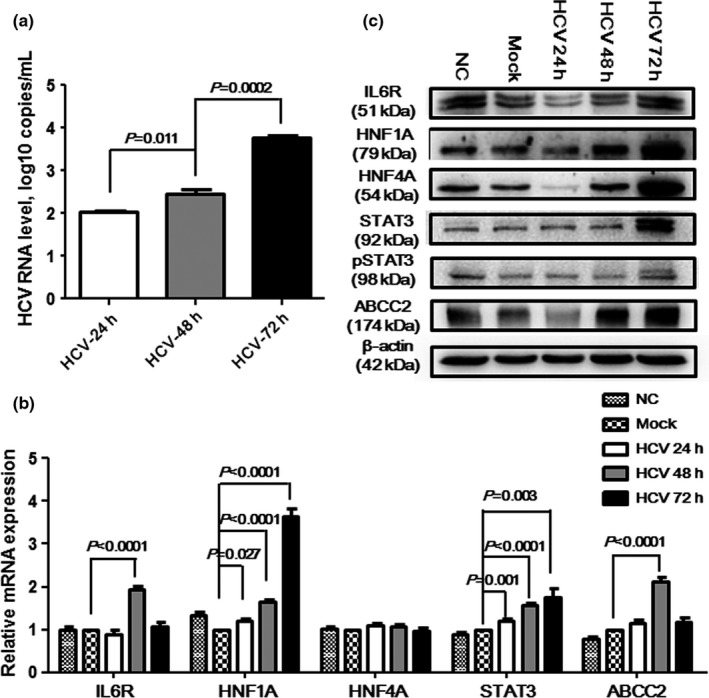
Figure 2.

HCV viral load and expression level of genes in STAT3 signaling pathway after HCV infection. (a) time‐dependent increasing HCV RNA level; (b) mRNA expression level variation of the IL6R, HNF1A, HNF4A, STAT3, and ABCC2 genes at 24, 48, and 72 hr after the Huh7.5.1 cells were infected with HCV; (c) expression level of the IL6R, HNF1A, HNF4A, STAT3, pSTAT3, and ABCC2 proteins at 24, 48, and 72 hr after the Huh7.5.1 cells were infected with HCV. NC means normal controls, i.e., the cells without HCV infection; mock means the negative controls, i.e., the cells were infected with PBS
