
Figure 3.
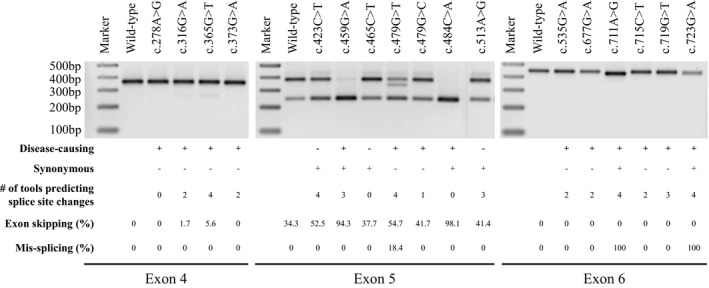
In vitro minigene analysis of select F9 variants in exons 4, 5, and 6. Representative agarose gel image showing the PCR amplification products of the studied F9 variants. Reporter minigene constructs were transfected into HEK293 cells and splicing pattern was assessed by PCR amplification of cDNA generated from total RNA. Expected sizes of PCR amplified products for exon 4, 5, and 6 reporter constructs were 360, 375, and 449 bp, respectively, in the event of normal splicing (exon inclusion) and 246 bp in the event of exon skipping. Exon skipping induced by individual variants was calculated using ImageJ software and numbers were shown in Table 5. The characteristics of tested variants with regard to disease‐causing (+) or not (−), synonymous (+) or not (−), number of tools (out of four in silico splice site tools; NNsplice, MaxEntScan, SpliceSiteFinder‐like, and Human Splicing Finder) that predicted splice site dysregulation, the extent of exon skipping and/or mis‐splicing in minigene assays, and their exonic locations are indicated below