
Figure 5.
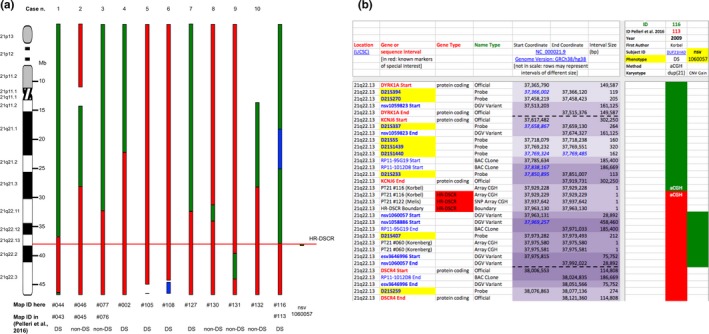
Concise outlook (a) of a portion of the partial trisomy 21 map. Each column represents the chromosome 21 structure (in megabases, Mb) of partial trisomy 21 subjects with or without Down syndrome (DS or non‐DS). For each subject the case number (n.), the updated map identifier (ID) and the corresponding previous map ID if present (Pelleri et al., 2016) are reported. The ten cases reanalyzed or reviewed here are reported together with Map ID #116 and the duplication coded as structural variant nsv1060057 which delimited the proximal and distal highly restricted DS critical region (HR‐DSCR, red continuous line) boundaries, respectively. Red boxes, candidate or not excluded regions; green boxes, excluded regions; white boxes: information not available with certainty; blue boxes, monosomic regions. A zoom‐in (b) of the case (#116 here and #113 in the previous study (Pelleri et al., 2016)) and the CNV (nsv1060057) strictly defining HR‐DSCR limits are shown here. Rows: Hsa21 sequence intervals (only those centered on HR‐DSCR are represented here). Red = candidate or not excluded regions; green = excluded regions. Levels of overlapping among intervals are indicated by increasingly darker violet color of the coordinates; blue italics indicate coordinates overlapping (Start or End) or nesting (Start and End) with the immediately previous interval (row). HR‐DSCR coordinates: 37,929,229–37,963,130. Complete map is available as Table S1