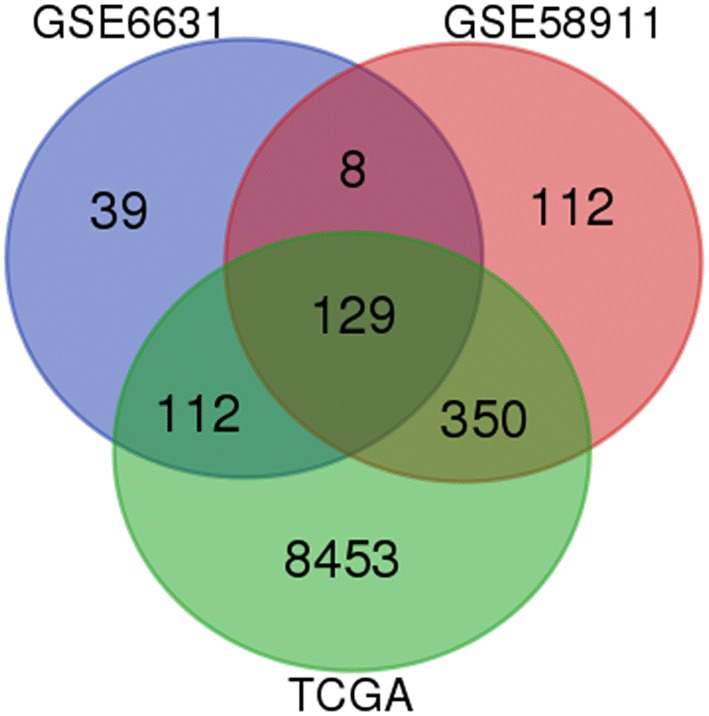
Fig. 1.

Identification of 132 common DEGs from the three cohort profile datasets (GSE6631, GSE58911 and TCGA) using Morpheus Website (https://software.broadinstitute.org). Different color areas represented different datasets. The cross areas meant the commonly changed DEGs. DEGs were identified with classical t test; statistically significant DEGs were defined with p < 0.05 and |logFC| > 1 as the cutoff criterion
