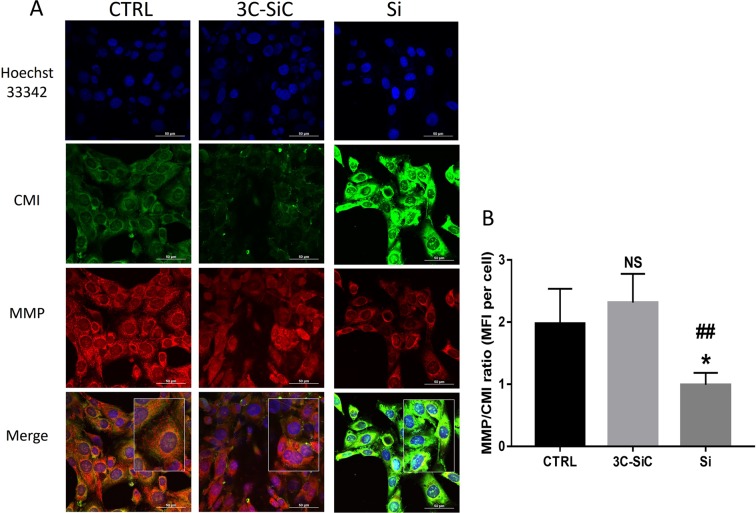
Figure 7.
Effects of Si and 3C-SiC on mitochondrial membrane potential and cell membrane integrity of OECs. (A) Representative results were taken from randomly selected slides scanned by a Nikon Ti Eclipse inverted microscope. MitoHealth (red) stains stable mitochondrial membrane potential, DEAD Green (green) stains deadly cells, Hoechst 33342 (blue) stains nuclei. A merged image for all experimental conditions was created with NIS Elements software (scale bar 50 μm). (B) Mean Fluorescence Intensities (MFI) ratio of MitoHealth (red) and DEAD Green (green) per cell. Differences in MFIs were not statistically significant between glass-plated control cells and those plated on 3C-SiC for 48 hours (3C-SiC vs Si, P < 0.005; control group vs Si, P < 0.05; differences in fluorescence intensity were not significant statistically between 3C-SiC and control group).

