Fig. 2.
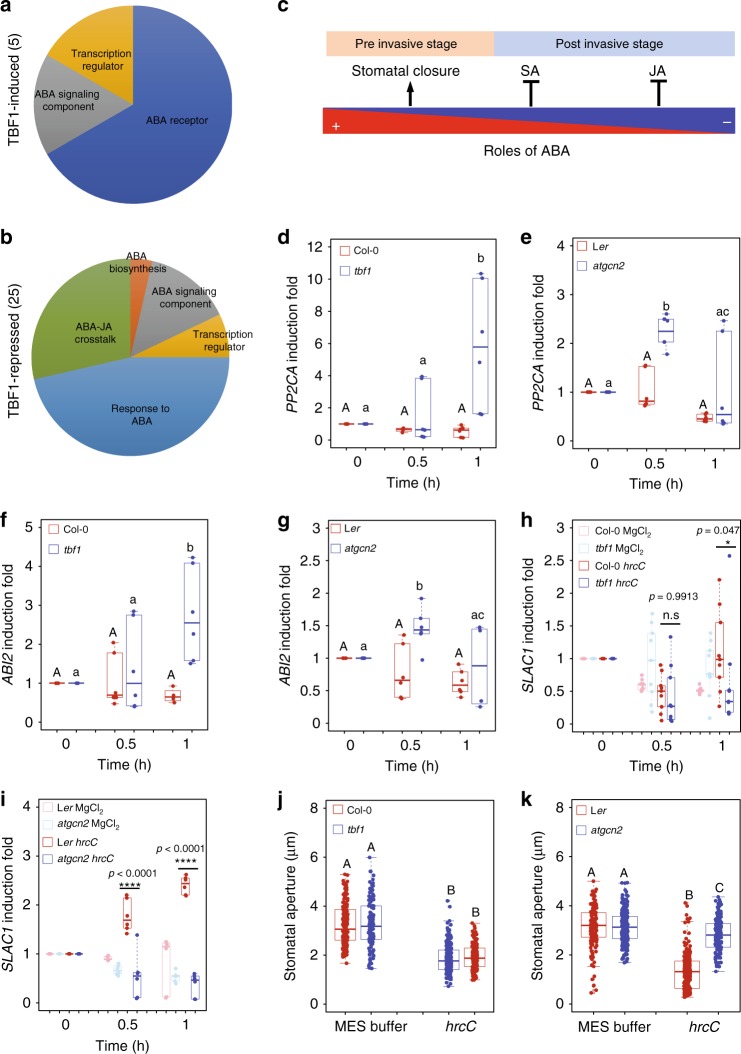
AtGCN2-TBF1 cascades transcriptionally manipulate ABA signaling components during preinvasive stage. Pie charts of GO terms of genes that are transcriptionally induced (a) and repressed (b) by TBF1 upon elf18 treatment. Details are listed in Supplementary Table 1. c Diagrammatic representation of a model illustrating the opposing roles of ABA in preinvasive and postinvasive phases of pathogen infection. Positive and negative contributions of ABA in plant defense are depicted in blue and red colors, respectively. Salicylic acid (SA) and jasmonic acid (JA) are shown [adopted from Ton et al.37]. Real-time RT-PCR analyses were performed on leaf samples of plants spray inoculated with Pst hrcC (OD600nm = 0.2) and transcript levels of PP2CA (d, e), ABI2 (f, g), and SLAC1 (h, i), respectively, were quantified. The box plots are prepared as described above. Median values are plotted in the boxes with data generated from three independent biological replicates. For d–g, two-way ANOVA with Tukey’s test (significance set at p ≤ 0.05) was performed; capital letters denote difference in wild-type plants (Ler or Col-0), and lower case letters denote difference in mutant plants (tbf1 or atcgn2). For h, i, two-way ANOVA with Tukey’s test was performed and asterisks above the bars signify statistically significant differences between Pst hrcC challenged Col-0 and tbf1 or Ler and atgcn2 plants (**p ≤ 0.01, ***p ≤ 0.001, n.s.—not significant). j, k Stomatal aperture width was measured in epidermal peels of 4-week-old tbf1 mutants (in Col-0 background; j) and atgcn2 mutants (in Ler background; k) that were treated with Pst hrcC (OD600nm = 0.2) for 1 h. The box plots are prepared as described above. Median values are plotted in the boxes with data generated from stomata derived from three independent biological replicates. One-way ANOVA with Tukey’s test (significance set at p ≤ 0.05) was performed and letters above the bars signify statistically significant differences among groups

