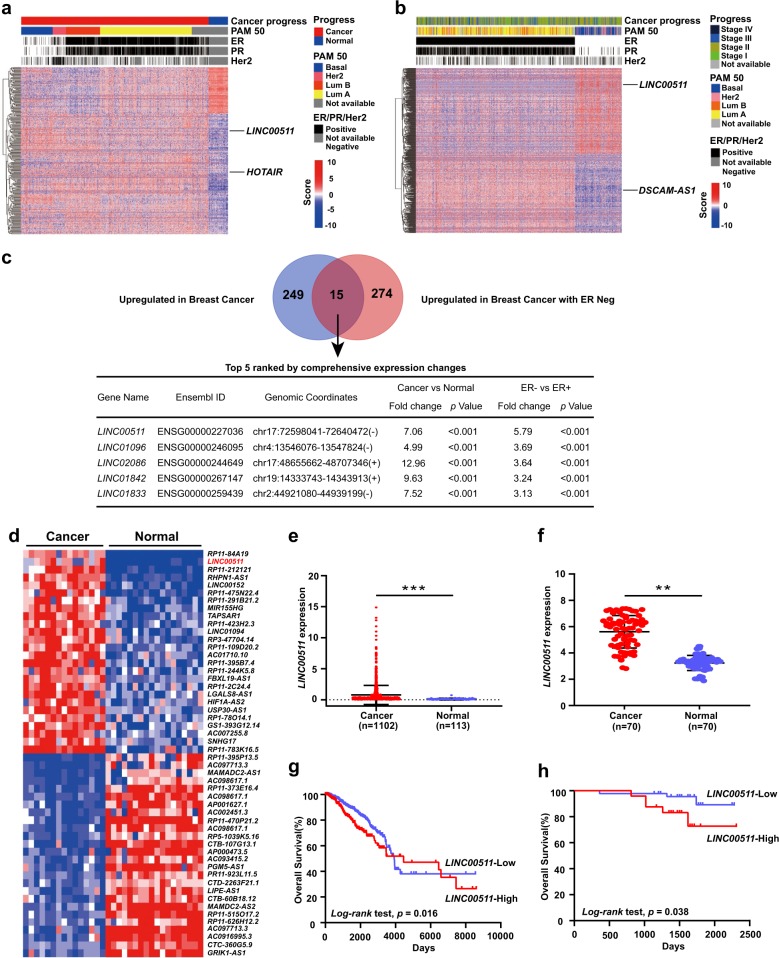
Fig. 1. Identification of breast cancer- and ER-negative-associated lncRNAs.
a Hierarchical clustering heat map of the differentially expressed lncRNAs in breast cancer tissues and adjacent normal tissues generated from RNA-seq data from the TCGA database. A total of 342 lncRNAs were differentially expressed, with a p value < 1E-20 and a fold change >2. Among these lncRNAs, 264 were upregulated in breast cancer tissues, and 78 were upregulated in adjacent normal tissues. The cancer progression, PAM50, ER, PR and HER2 statuses of each sample are shown above the heat map. HOTAIR was employed as a positive control. b Hierarchical clustering heat map of the differentially expressed lncRNAs in ER-positive and ER-negative breast cancer tissues generated from RNA-seq data from the TCGA database. A total of 551 lncRNAs were differentially expressed, with a p value < 1E-4 and a fold change >2. Among these lncRNAs, 262 were upregulated in ER-positive breast cancer tissues, and 289 were upregulated in ER-negative breast cancer tissues. The cancer progression, PAM50, ER, PR and HER2 statuses of each sample are shown above the heat map. DSCAM-AS1 was employed as a positive control. c Venn diagram depiction of the intersection of the lncRNAs upregulated in both breast cancer and ER-negative breast cancer tissues (264 versus 289, respectively). The top five lncRNAs are listed according to the prioritization of variation in ER-negative-associated lncRNAs. d Heat map of the differentially expressed lncRNAs in breast cancer tissues, adjacent normal tissues and non-breast cancer patient tissues generated from RNA-seq data of the whole-transcriptome sequencing of 33 breast cancer specimens (RNA-seq data of this study has been deposited into the NCBI GEO database under accession number GSE71651). e Scatter diagram depiction of LINC00511 expression in breast cancer tissues and adjacent normal tissues generated from the TCGA database. f qRT-PCR analysis of LINC00511 expression in 70 pairs of breast cancer and adjacent normal tissues. g Kaplan–Meier survival analysis of OS in breast cancer patients based on LINC00511 expression generated from the TCGA database (n = 1086, high = 379, low = 707, p < 0.05). h Kaplan–Meier survival analysis of OS in breast cancer patients based on LINC00511 expression in our cohort (n = 70, high = 24, low = 46, p < 0.05). Data are shown as the mean ± standard deviation (SD). Student’s t test was used for the statistical analysis: *p < 0.05; **p < 0.01; ***p < 0.001. Data represent three independent experiments

