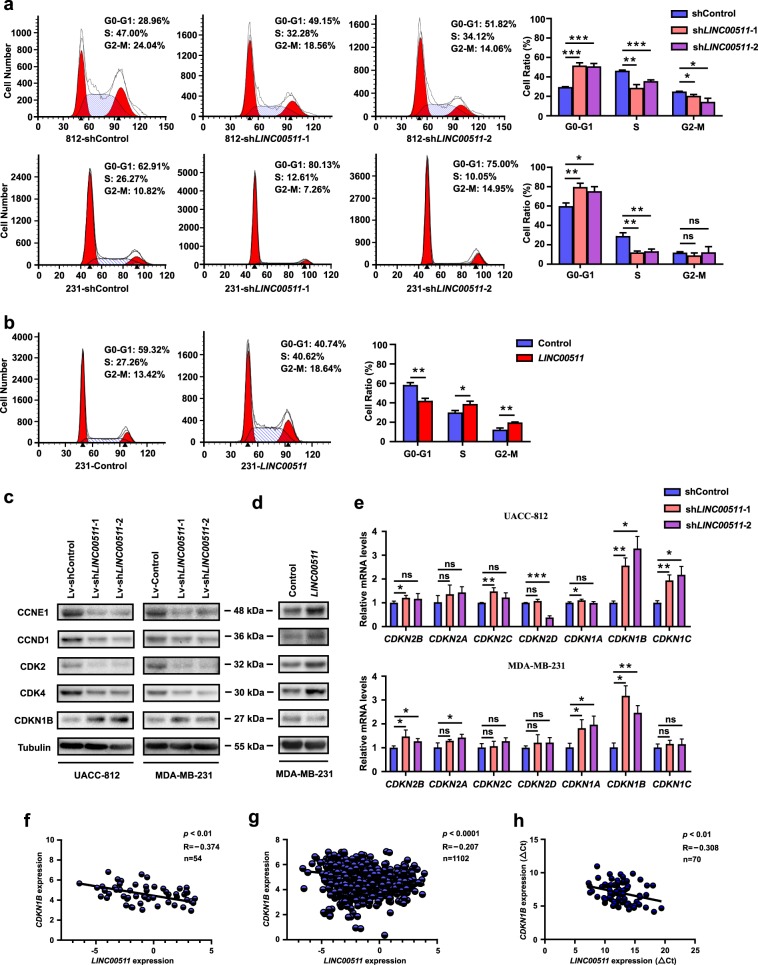
Fig. 4. LINC00511 accelerates the G1/S transition, in part, by regulating CDKN1B expression.
a Flow cytometry (cell cycle distribution) analysis of the proportion of UACC-812 and MDA-MB-231 cells in the G0/G1, S and G2/M phases following the knockdown of LINC00511 expression. b Flow cytometry (cell cycle distribution) analysis of the proportion of MDA-MB-231 cells in the G0/G1, S and G2/M phases following the overexpression of LINC00511 expression. c Western blot analysis of the key cell cycle-related proteins (CCNE1, CCND1, CDK4, CDK2 and CDKN1B) of UACC-812 and MDA-MB-231 cells following the knockdown of LINC00511 expression. d Western blot analysis of the key cell cycle-related proteins (CCNE1, CCND1, CDK4, CDK2 and CDKN1B) of MDA-MB-231 cells following the overexpression of LINC00511 expression. e qRT-PCR analysis of CDKI mRNAs (the INK4 and Cip/Kip families) of UACC-812 and MDA-MB-231 cells following the knockdown of LINC00511 expression. f Scatter diagram analysis of the correlation between LINC00511 and CDKN1B expression obtained from the CCLE database. g Scatter diagram analysis of the correlation between LINC00511 and CDKN1B expression generated from the TCGA database. h Scatter diagram analysis of the correlation between LINC00511 and CDKN1B expression in 70 breast cancer tissues in our cohort. Data are shown as the mean ± SD. Student’s t test was used for the statistical analysis: *p < 0.05; **p < 0.01; ***p < 0.001. Data represent three independent experiments

