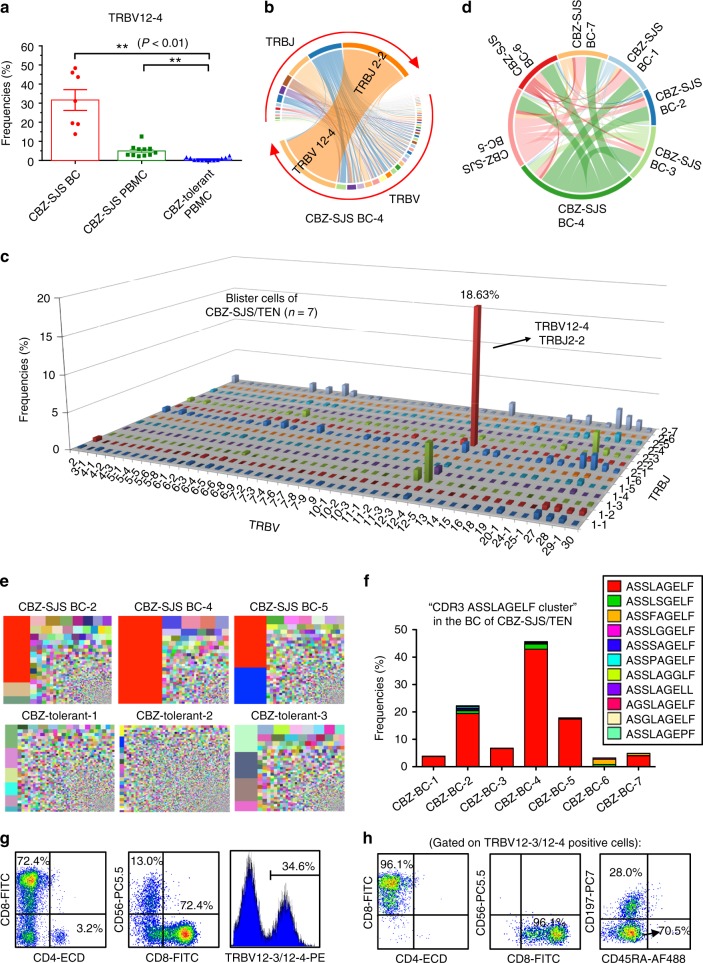
Fig. 2.
Identification of a public TCR from the blister cells of patients with CBZ-SJS/TEN. The TCR repertoire of samples was analyzed by next-generation sequencing. a The frequencies of TRBV12-4 gene usage were significantly higher in PBMC (n = 11) and blister cells (n = 7) of patients with CBZ-SJS/TEN, when compared with the PBMC of CBZ-tolerant controls (n = 12). The results are expressed as mean ± s.e.m. with each dot representing the data of an individual. Statistical analysis was generated using an unpaired, two-tailed Student’s t test. **P < 0.01. b A representative TRBV–TRBJ junction Circos plot of blister cells of a CBZ-SJS/TEN patient (case 4). Arcs correspond to different V and J segments. Ribbons represent V/J pairings with sizes scaled to pairing frequency. c The mean frequencies (%) of TRBV/TRBJ pairings in the blister cells from CBZ-SJS/TEN patients (n = 7). The x- and y-axis represent the TRBV and TRBJ regions, respectively, and the z-axis indicates the mean frequencies of TCRβ rearrangements. d The pairwise overlap Circos plot shows the overlapping CDR3 clonotypes among the seven blister samples of cases 1–7. e Treemaps of TCRβ CDR3 clonotypes for the representatives of blister cells of patients with CBZ-SJS/TEN (upper panel) and the PBMC of CBZ-tolerant controls (lower panel). Colors represent individual specific CDR3 clonotypes, and the area of each color square represents the frequency in the sample. The specific TCRβ CDR3 “ASSLAGELF” is labeled in red. f The frequencies of “CDR3 ASSLAGELF cluster” which includes the TCR clonotypes carrying similar CDR3 sequences with one amino acid difference in the blister cells of CBZ-SJS/TEN patients. g, h Flow-cytometry analysis of the cell populations expressing the markers of CD4, CD8, CD56, TRBV 12–3/12–4, CD45RA, and CD197 in the blister cells of patients with CBZ-SJS/TEN

