Fig. 1.
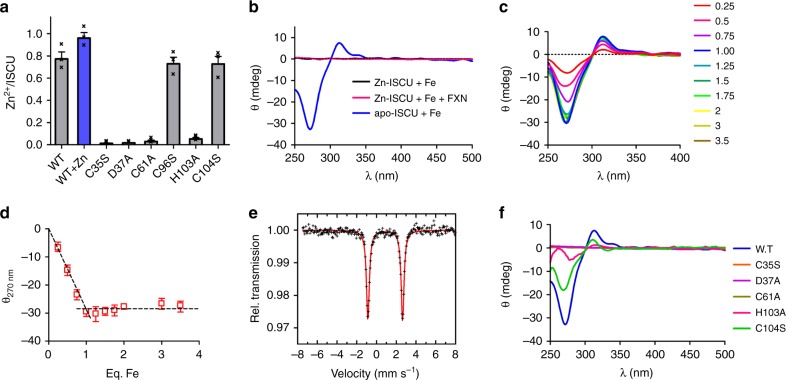
Characterization of iron-loaded ISCU. a Zinc content of WT ISCU as purified (gray) and after zinc repletion (blue), and of the C35S, D37A, C61A, C96S, H103A, and C104S mutants, indicated as molar ratio of zinc ion per ISCU protein. b CD spectra of Zn-ISCU with (pink) and without FXN (black) and of apo-ISCU (blue), incubated with one molar equivalent of Fe2+ ions. c Titration of apo-ISCU with Fe2+ ions monitored by CD. Amounts of iron are indicated as molar ratio of iron to ISCU. d Plot of the values of the CD signal at 270 nm from the spectra in c at each concentration of iron. e Mössbauer spectrum of apo-ISCU incubated with one equivalent of 57Fe enriched Fe2+ ions. The red solid line represents the best fits of the data achieved using the components displayed as black solid lines. See Supplementary Table 1 for parameters. f CD spectra of apoISCU proteins WT (blue), C35S (orange), C61A (brown), D37A (purple), H103A (pink), and C104S (green) incubated with one molar equivalent of Fe2+ ions. Errors bars represent standard deviation from n = 3 independent experiments and source data for panels a, d are provided as a Source Data file

