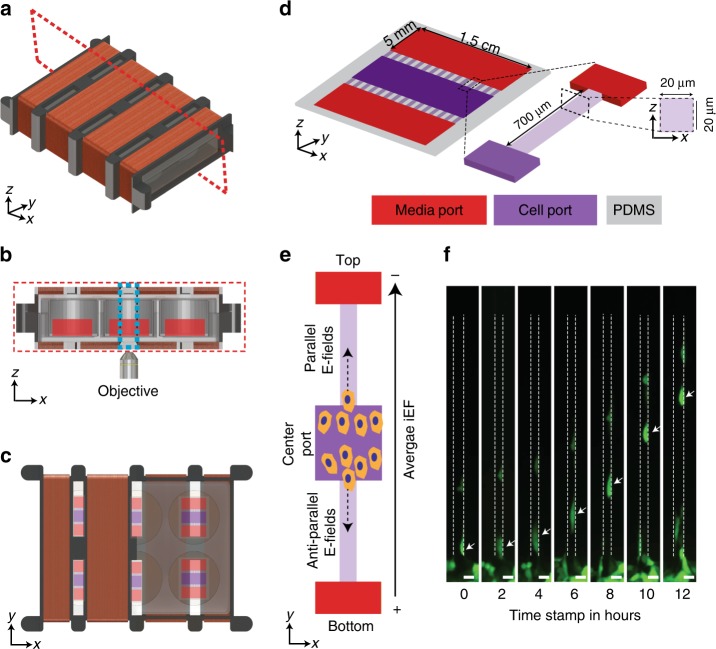
Fig. 1.
Experimental setup for quantifying cell migration in response to iEF treatment. a Isometric view of the Helmholtz coil used to apply inductive electric field (iEF) treatment on migrating cells. b Cross-section cut (plane marked with dotted red line in a indicating the location of the microfluidic bi-directional migration (MBDM) assay) and its relative position with the microscope objective. c Top view of the Helmholtz coil showing the location of devices in d and the microscope observation window. d Schematic of MBDM assay. Cells are seeded in the center port (purple) and are tracked as they migrate to the outer ports (red) through the microtracks (inset) connecting them. e Cells from the center port can migrate into the opposing microtracks and migrate either toward the top or bottom media ports and under the influence of iEFs applied either parallel or antiparallel to the direction of cell migration. f Time-lapse images of GFP-tagged MDA-MB-231 cell migrating through a single microtrack. (*Scale Bar = 20 µm)

