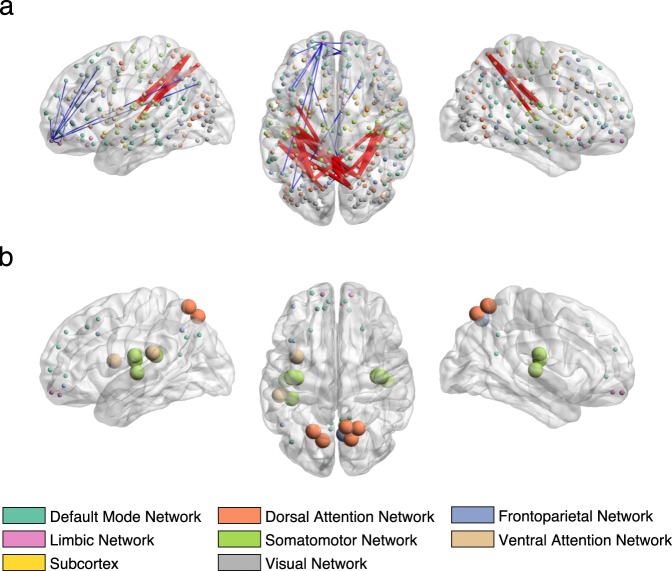
Figure 3.
Correlations between the brain connectivity variables and brain canonical variate (brain scores of all subjects) of the first CCA mode in sagittal (left and right) and axial view (middle). (a) Top 20 most positively and top 20 most negatively correlated brain connections. The thickness of the edges is proportional to the absolute correlation (red for positive correlations and blue for negative correlations). (b) Top 20 most positively and top 20 most negatively correlated brain connections summarized by nodes. Node size is proportional to the mean absolute correlation. Nodes are colour coded by resting state networks assigning each node to one of the 7 cortical networks (based on the maximal surface based overlap) described in Yeo et al.44 or the subcortex. The list of correlation values and respective labels can be found in Supplementary Table S2.

