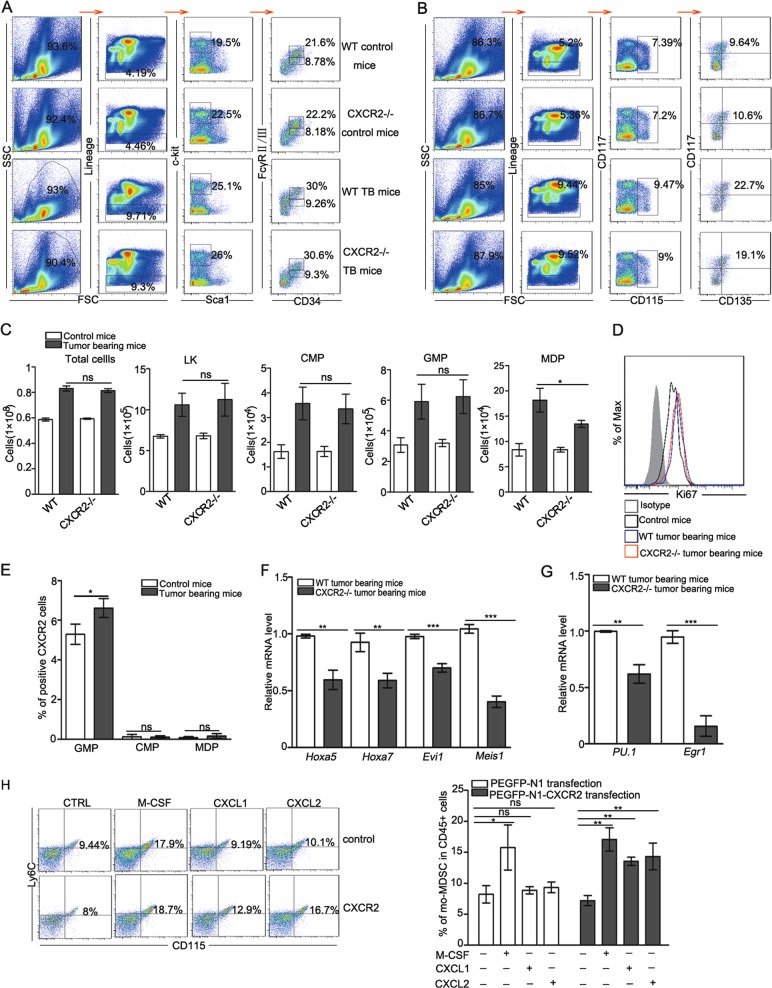
Fig. 3. Lack of CXCR2 decreases the production of MDPs, the hematopoietic progenitors of mo-MDSCs.
a, b The classification of HSPCs was analyzed by flow cytometry. Bone marrow cells from control and tumor-bearing mice were stained with antibodies specific to Lin-specific antigens, as well as Sca-1, c-Kit (CD117), CD34, FcγRII/III, CD115, and CD135. c The total number of bone marrow cells and quantitative analyses of HSPCs subsets as shown in a, b: LKs (Lin−Sca-1−c-Ki+), CMPs (LK, FcγRII/IIIintCD34+), GMPs (LK, FcγRII/IIIhiCD34+), MDPs (Lin−c-Kit+CD135+CD115+ Ly6C−CD11b−). d The expression of Ki67 in MDPs from WT control mice, WT, and CXCR2−/− tumor-bearing mice was analyzed by flow cytometry. e The expression of CXCR2 in GMPs, CMPs, and MDPs was analyzed by flow cytometry in control and tumor-bearing mice. f, g The level of Hoxa5, Hoxa7, Evi1, Meis1, Pu.1, and Egr1 mRNA expression in the HSPCs of WT and CXCR2−/− tumor-bearing mice was evaluated by qPCR. h The percentage of mo-MDSCs was analyzed by flow cytometry in 32D clone three cells transfected with an empty vector or CXCR2. The treated cells were administered with M-CSF, CXCL1, or CXCL2 for 5 days in the presence of GM-CSF. The 32D clone three cells transfected with CXCR2 were treated with an equal concentration of M-CSF as the positive control group. Bars represent the mean ± SD of five independent experiments. A one-way ANOVA with repeated measures followed by a Dunnett’s post hoc test or two-way ANOVA followed by a Holm-Sidak’s post hoc test was used to determine the level of statistical significance (*p < 0.05; **p < 0.01; and ***p < 0.001; ns, not significant)

