
FIGURE 2.
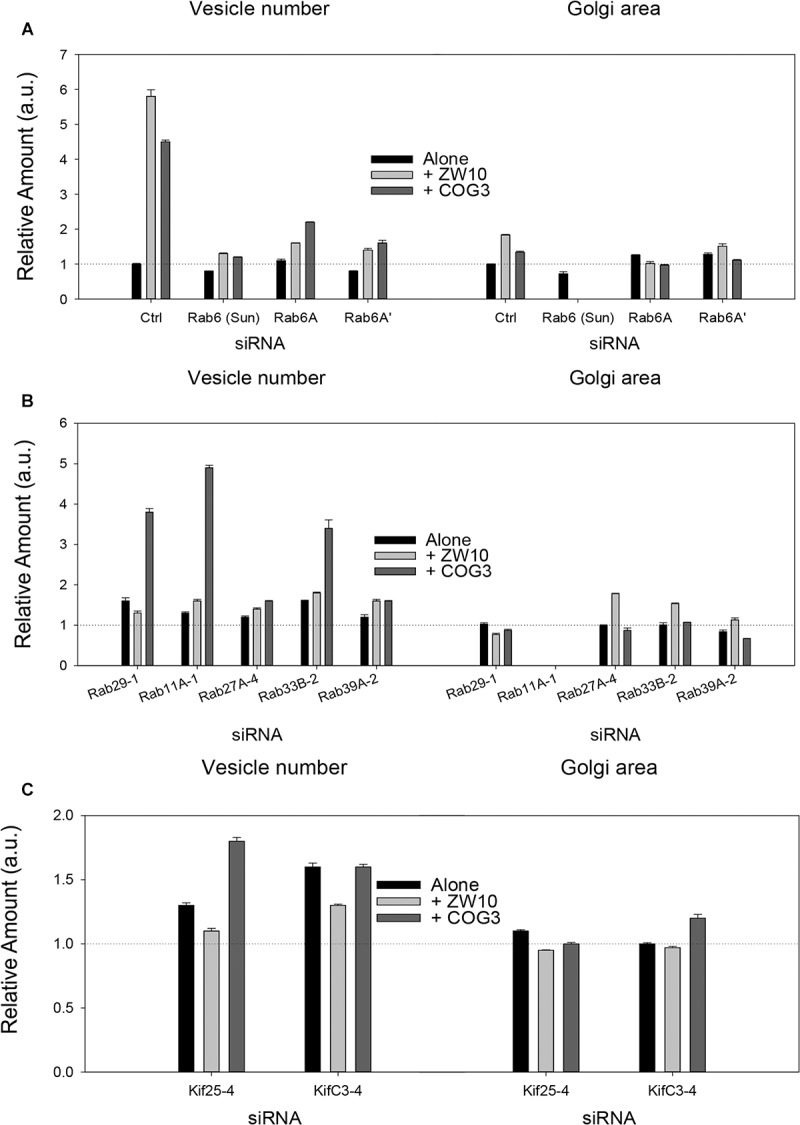
Fluorescence microscopy quantification of Golgi fragmentation and area following RNAi incubation directed against hit Rabs or Kifs. (A) Rab6 isoforms, (B) Rab hits, (C) negative end Kif hits. Quantification of Golgi fragmentation and area was based on the distribution of GalNAcT2-GFP fluorescence. Huygens Professional software was used to deconvolve the images to sharpen the distinction between Golgi apparatus and general cytoplasm. Following deconvolution images were then segmented to determine Golgi fragments and area using iVision for Mac software. At least 30 cells were analyzed per data point and data were normalized to control. The siRNA sequences directed against the proteins labeled on the X-axis are listed in Supplementary Tables 1, 2. The suffix number –1, –2 or –4 following the Rab and Kif corresponds to the siRNA sequence used in the experiment. Bars are plotted ± SEM.