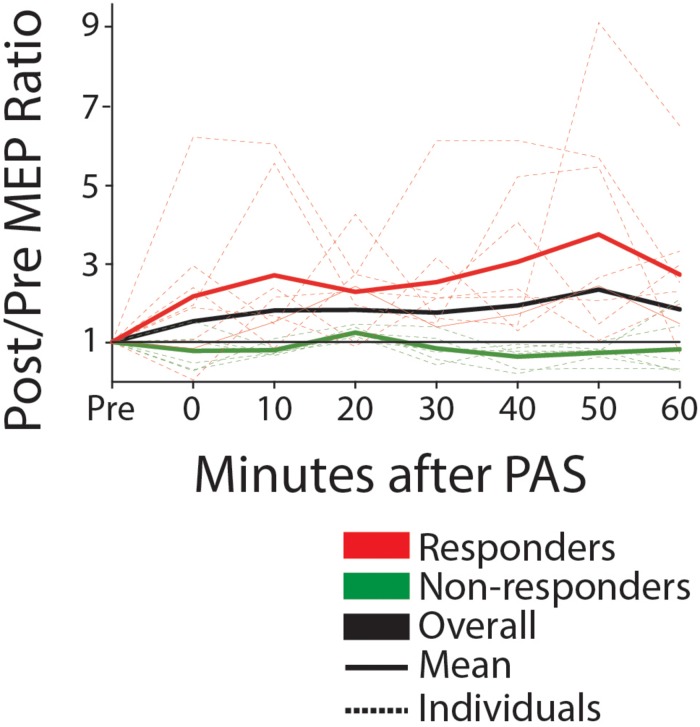
FIGURE 5.
MEP amplitude pre and post-PAS (0–60 min) for responders (mean post >10% mean pre) and non-responders, off-drug (ratio post/pre). Solid lines show group mean, dotted show individual data. Black line is the mean for the entire group. We note that approximately half of participants are responders, with a mean increase of greater than 200% post versus pre.

