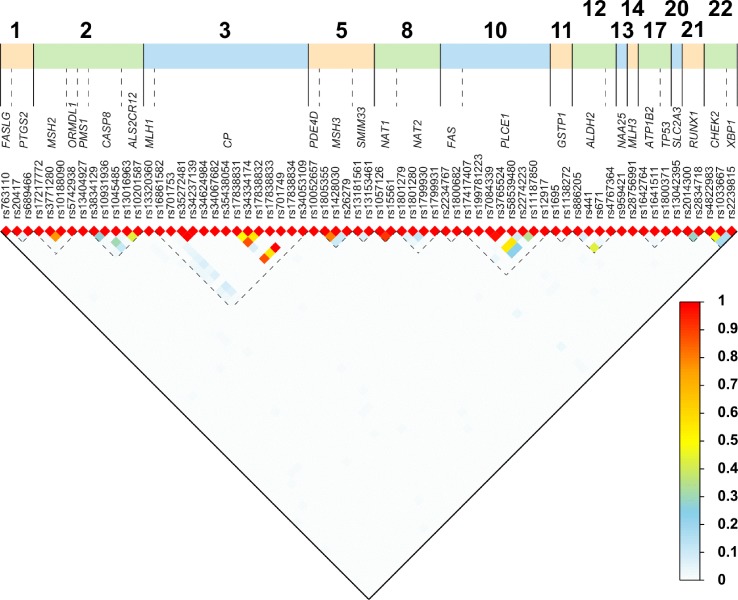
Figure 2.
Linkage disequilibrium (LD) plot for paired SNPs. We obtained the rs numbers of the variants from dbSNP (version 152; April 2019; (https://www.ncbi.nlm.nih.gov/snp/)) and used the canonical SNP identifier. To determine the LD between the SNPs, we obtained the imputed data set from the Thousand Genomes project (1000 Genomes Release Phase 3 2013-05-02) and used bcftools to extract all individuals from African populations not including African Americans, and the 77 SNPs discussed here using all synonyms (alternative rs IDs) for SNPs (Auton et al., 2015). We obtained a dataset of 504 individuals and 67 SNPs. We computed all pair-wise r2 using PLINK (v1.09) (Danecek et al., 2011; Chang et al., 2015).

