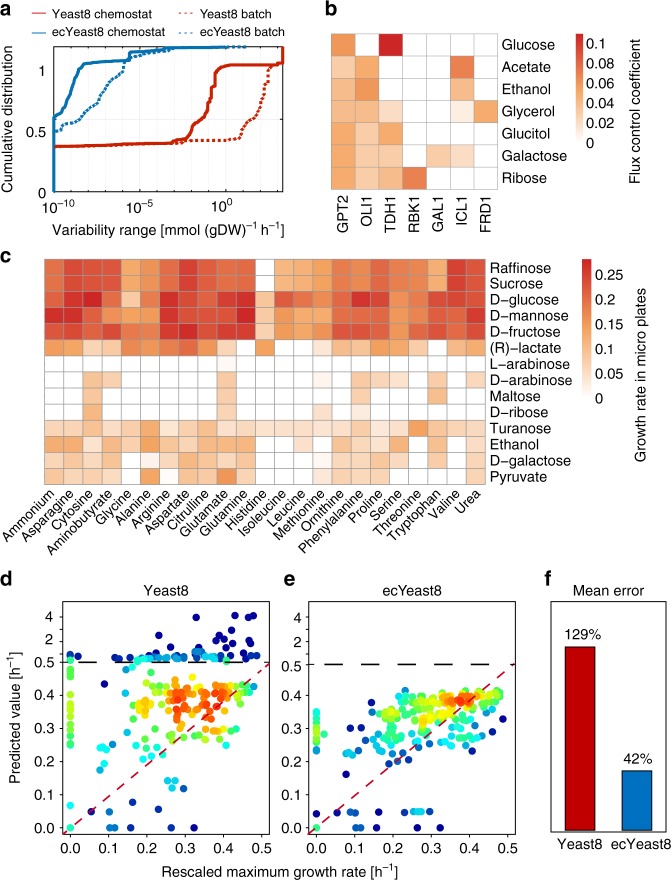
Fig. 2.
ecYeast8 with enzyme constraints shows improved fit over the regular Yeast8 metabolic model. a Comparison of model performance between ecYeast8 and Yeast8 based on flux variability analysis (FVA). b Flux control coefficient analysis with ecYeast8 simulated on different carbon sources in minimal medium with the growth as the objective function. c Growth rate of S. cerevisiae S288C in micro-plate under different combinations of carbon and nitrogen sources. d, e Prediction of maximum specific growth rates under different combinations of carbon and nitrogen sources using Yeast8 (d) and ecYeast8 (e), the red colour zones mean that the data points are overlapped due to higher density. f Mean errors for comparison of measured and predicted growth rates using Yeast and ecYeast8

