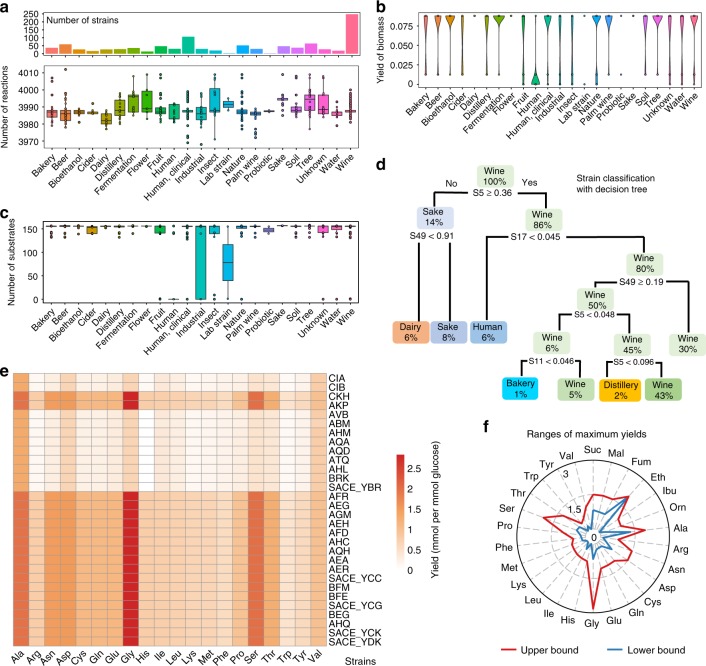
Fig. 3.
Conservation and diversity analysis of yeast metabolism through reconstruction of 1,011 strain-specific GEMs (ssGEM). a Amount of reactions of ssGEMs for strains from different ecological origins. The top column graph describes the strain number from each ecological origin. Different strains from one ecological origin could have the equal number of reactions. In the box plots of this work, if not mentioned, the bold line in the box represents the median. The lower and upper bounds of box show the first and third quartiles, respectively, and whiskers indicate ± 1.5× the interquartile range (IQR). The color dots overlaid represent the corresponding data points. b Prediction of biomass yield using ssGEMs on minimal media with glucose as the carbon source. c Number of substrates which can be used in silico for strains from different ecological origins. In the simulation using ssGEMs, 58 carbon sources, 46 nitrogen sources, 41 phosphate sources and 12 sulphate sources were used respectively in the minimal media. d Decision tree classification of strains according to the in silico maximum growth rate on different carbon sources (S5: Latic acid, S11: Serine, S17: Sorbitol, S49: Trehalose). The in silico uptake rate for each carbon source was set at 10 mmol (gBiomass)−1 h−1. e Comparison of the yield of 20 amino acids from glucose for 30 strains from the group of “industrial strain”. f Comparison of in silico range of maximum yields of 20 amino acids and six key chemicals for all 1011 ssGEMs

