
Fig. 2.
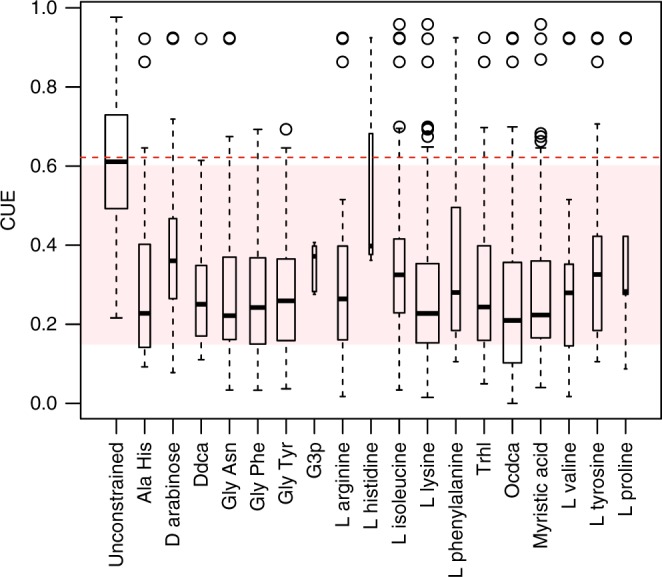
Substrate-limited CUE. Boxplot of average CUE values across all taxa under potential and constrained scenarios. Boxplot width is proportional to number of models with a given constraining reaction. Dashed red line shows average for potential CUE. Shaded region shows range of values typically used in biogeochemical models. Solid lines within boxplots show median. Bottom and top edges of boxes represent 25th and 75th percentiles, respectively. Whiskers demarcate minimum and maximum datapoints within 1.5× of the interquartile range