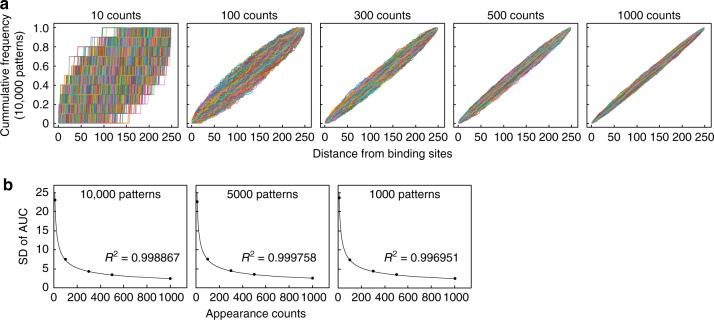
Fig. 2.
Simulation for determining standard deviations of AUC in MOCCS2. a Shown are 10,000 patterns of cumulative relative frequency curves calculated from random histograms with appearance counts indicated above individual graphs. b Standard deviations (SDs) of AUC calculated from indicated patterns of random histograms (y axis) were plotted against appearance counts (x axis), and well fitted with an exponential equation “Y = 71.303 × X−0.5”. See also Supplementary Fig. 2 for 5000 and 1000 patterns of the cumulative relative frequency curves

