Fig. 5.

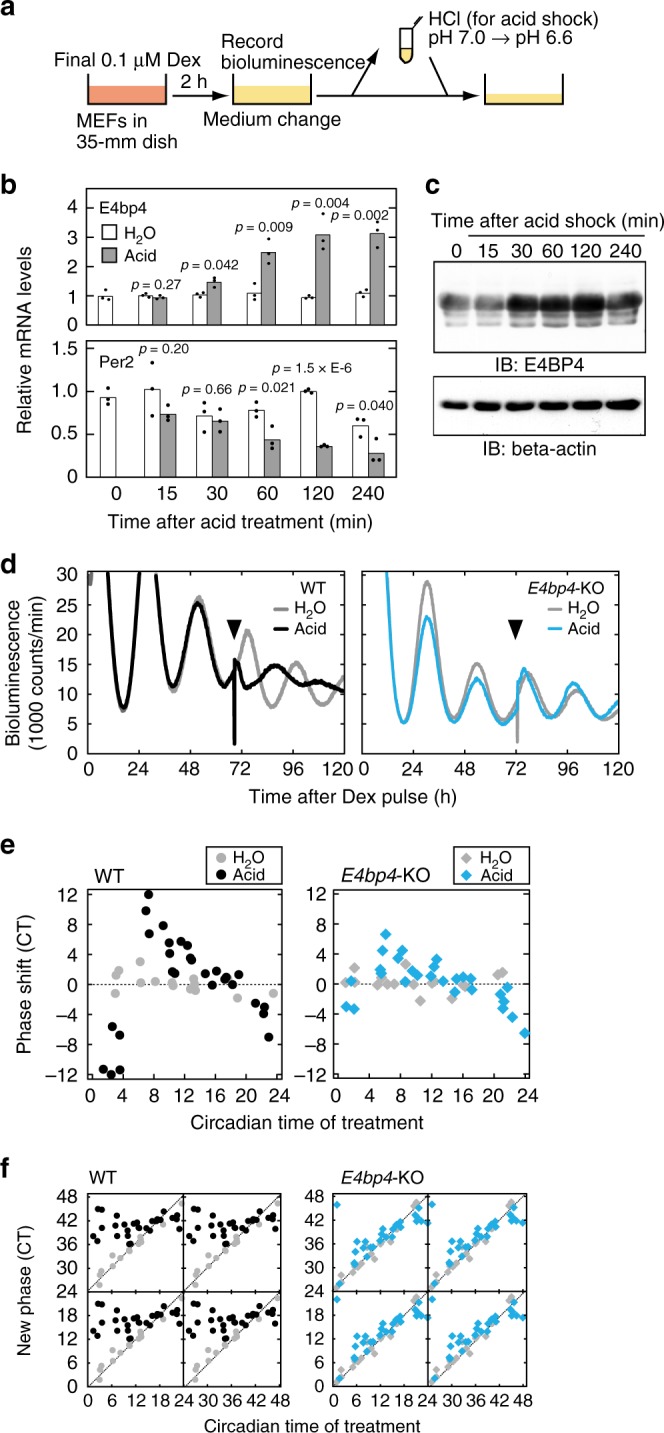
Essential role of E4BP4 for acid-evoked phase resetting. a For acid treatment, pHo was changed from 7.0 to 6.6 by adding 1M HCl solution to the culture media. In control experiments, the same volume of water was added (H2O). b Changes of E4bp4 and Per2 mRNA levels in response to the acid treatment. MEFs collected at the indicated time after the acid treatment were subjected to qRT-PCR analysis. The signal values for each mRNA were normalized to those of Rps29 mRNA (internal control) and the mean value at time 0 was set to 1. Bars and dots represent means and individual data (n = 3), respectively. The indicated p values were calculated by two-sided Student’s t test versus H2O. c Induction of E4BP4 protein in response to the acid treatment. MEFs collected at the indicated time after the acid treatment were subjected to immunoblot analysis with the indicated antibodies. Full images of the blots are shown in Supplementary Fig. 8. Data shown are the representative from three independent experiments with similar results. d Phase shifts of bioluminescence rhythms in the PER2::LUC MEFs (WT) or PER2::LUC/E4bp4-KO MEFs (E4bp4-KO) in response to the acid treatment. The timing of the acid treatment was indicated by arrowheads. e, f Phase response curves (PRCs) and phase transition curves (PTCs) of the cellular rhythms in response to the acid treatment in the control PER2::LUC MEFs (WT) or PER2::LUC/E4bp4-KO MEFs (E4bp4-KO)
