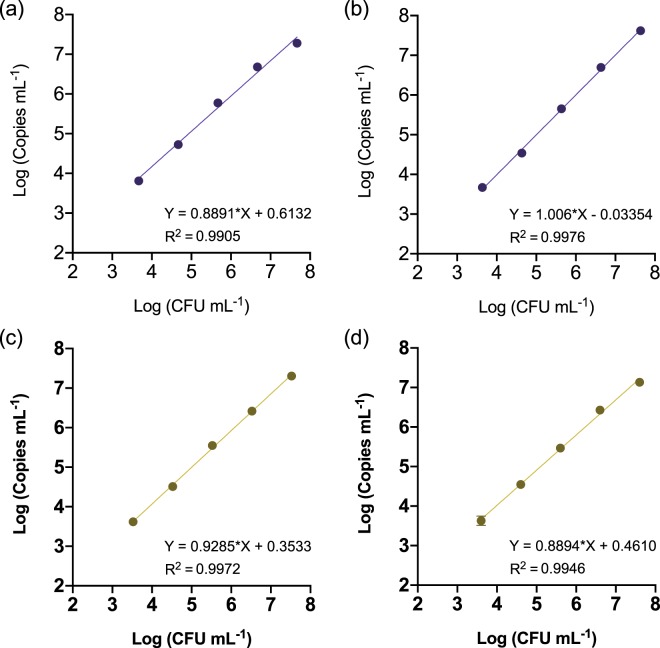
Figure 1.
Correlation between the Log-transformed values of plate counts and QS3D dPCR absolute quantification values. Serial tenfold dilutions of E. amylovora ATCC 49946 (a,b) and CFBP 1430 (c,d) were performed in apple (a,c) and pear (b,d) branch macerates prepared in AMB, followed by DNA extraction and dPCR using a protocol transferred from Pirc et al.31. Dots and error bars are average values of three biological repeats of the experiment ± SD. Absent error bars indicate SD values smaller than the represented symbols.

