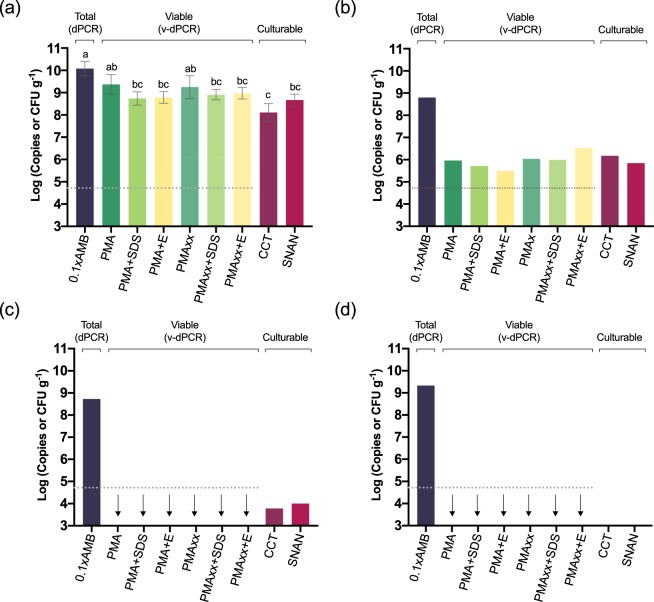
Figure 10.
E. amylovora total, live and culturable cell populations in fire blight cankers on pear. Fire blight infections originated in early-spring of 2016, and cankers collected in mid-summer (July 2016) (a) and mid-winter (January 2017) (b–d). For sample analysis, cankers were homogenized with 0.1xAMB. Total cell counts were performed by DNA extraction and dPCR. For v-dPCR, samples were treated with PMA, PMAxx, or any of these dyes combined with SDS (+SDS) or PMA Enhancer (+E). In both cases, dPCR was performed using primers Ams06KbF/Ams189R and the probe Ams141T. Culturable cell counts were performed by spread plate on SNAN and CCT media. In cankers collected in mid-summer, E. amylovora quantification values were similar, so each column represents mean values of total, viable and culturable cell counts of three different cankers, with error bars indicating the SD (a). In cankers collected in mid-winter, substantial differences among cankers in E. amylovora populations were observed. Separate graphs were used to highlight differences among cankers (b,c,d). Dashed lines represent the limit of detection and quantification of dPCR. Arrows represent viable cell counts equal to 0 or below the dPCR detection limit. The absence of columns corresponding to plate counts represent values below the detection limit of the technique, which is shown in graphs as the minimum value at the Y axis.

