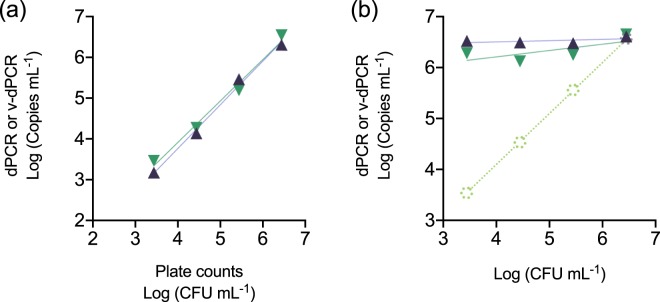
Figure 2.
Correlation between plate counts and v-dPCR values in the presence of dead cells. Apple macerates prepared in AMB were inoculated with E. amylovora live cells ranging from 103 to 106 CFU mL−1 (control) (a), or the same range of live cell concentrations, but with a constant background of 106 dead cell mL−1 (b). Each dilution was subjected to dPCR to quantify total target DNA copies mL−1 (purple), and v-dPCR, to quantify the copies mL−1 coming from live cells (green), using primers and probe of Pirc et al.31. The linear regression equations and coefficients of correlation corresponding to dPCR and v-dPCR values in (a) were Y = 1.070*X–0.5165 (R2 = 0.9925) and Y = 1.014*X–0.1432 (R2 = 0.9825), respectively. Dashed lines and symbols in (b) represent the expected live cell concentration values (pale green), calculated based on plate counts of the live cell stock used to prepare samples. The slopes of the regression lines corresponding to dPCR and v-dPCR values in (b) did not statistically differ from 0 (p > 0.05). In both graphs, each value is the mean of three independent repeats. Absent error bars indicate SD values smaller than the represented symbols.

