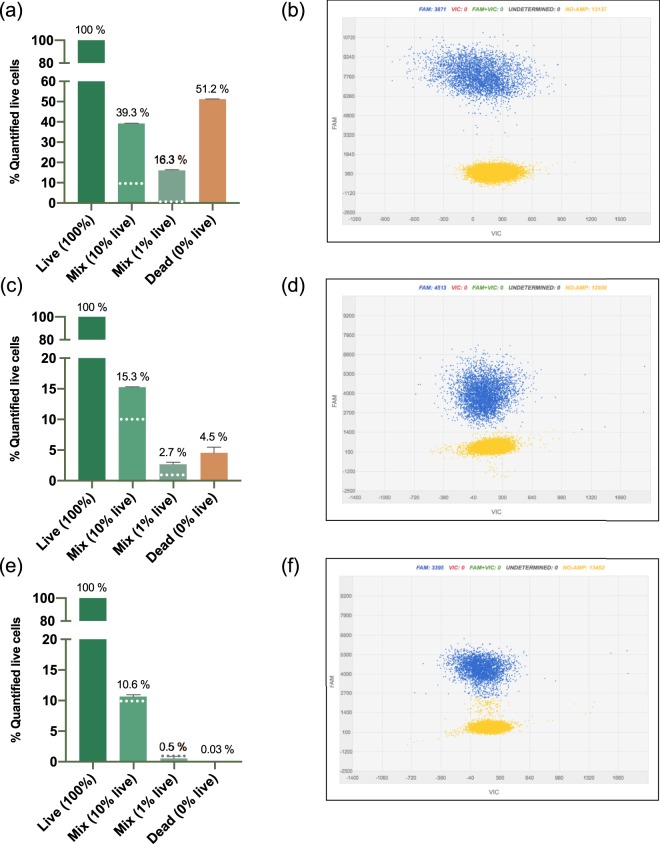
Figure 4.
Effect of the thermal cycle number and the amplicon size on the reduction of false-positive signals by v-dPCR. Apple branch macerates prepared in AMB were inoculated with either E. amylovora at 7 × 10⁶ CFU mL−1 (100% live cells), 7 × 10⁶ dead cells mL−1 (0% live cells), or live/dead cell mixtures containing a 10% and a 1% of live cells and a 90% and a 99% of dead cells, respectively. After PMA treatment and DNA extraction, dPCR was conducted using: i) same primers and probe as Pirc et al.31, with 40 amplification cycles (a,b); ii), reducing the number of thermal cycles to 30 (c,d); iii) using a primers targeting a 966 bp DNA sequence, and 40 amplification cycles (e,f). Each column shows mean values of two independent experiments. Error bars are the SD. Dashed horizontal lines indicate the theoretical percentage of live cells in samples containing live/dead cell mixtures (10% and 1%). Representative dPCR 2D scatter plots showing fluorescence values of the FAM labelled probe in wells with positive calls (blue) and fluorescent values corresponding to negative amplifications (yellow) (b,d,f).

