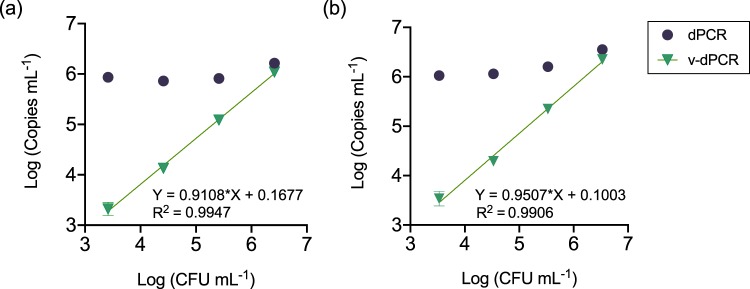
Figure 8.
Correlation between plate counts and v-dPCR values in the presence of dead cells, using improved methods for plant material processing and dPCR. Apple and pear branch macerates prepared in 0.1xAMB were inoculated with increasing live cell concentrations (from 103 to 106 CFU mL−1) in a constant background of 106 dead cell mL−1. Total cell counts were performed by dPCR. For viable cell counts, samples were treated with PMA plus 1x PMA Enhancer before dPCR. In all cases, dPCR was performed using primers targeting a 627 bp DNA sequence. Each dot corresponds to mean values of two independent experiments performed in triplicate. Error bars show the SD. Absent error bars indicate SD values smaller than the represented symbols. Solid lines represent the linear regression best fit through all the v-dPCR dataset points. The corresponding linear regression equations and coefficients of correlation (R2) are also indicated.

