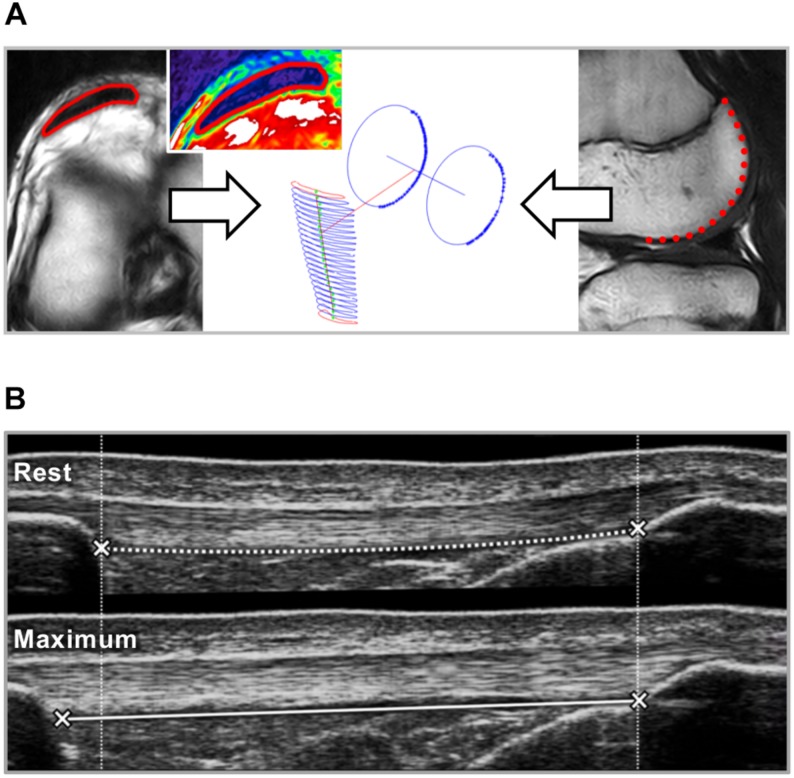
FIGURE 1.
(A) Patellar tendon cross-sectional area (CSA) and moment arm were determined based on magnetic resonance images. In transverse plane images the tendon CSA (red) was segmented over the full length of the tendon (left; inset picture shows the tendon in NIH color scale). Sagittal plane segmentations of the posterior contours of the lateral and medial femur condyles were approximated using a circular fit and the line connecting the centers of the circles was defined as rotation axis (Churchill et al., 1998). The perpendicular distance to the tendon line of action represents the tendon moment arm. (B) The elongation of the patellar tendon during isometric ramp contractions from rest to maximum was measured using ultrasound. Tendon strain, stiffness and elastic modulus were calculated based on the force-elongation and stress-strain relationship between 50 and 80% of the maximum tendon force or stress.

