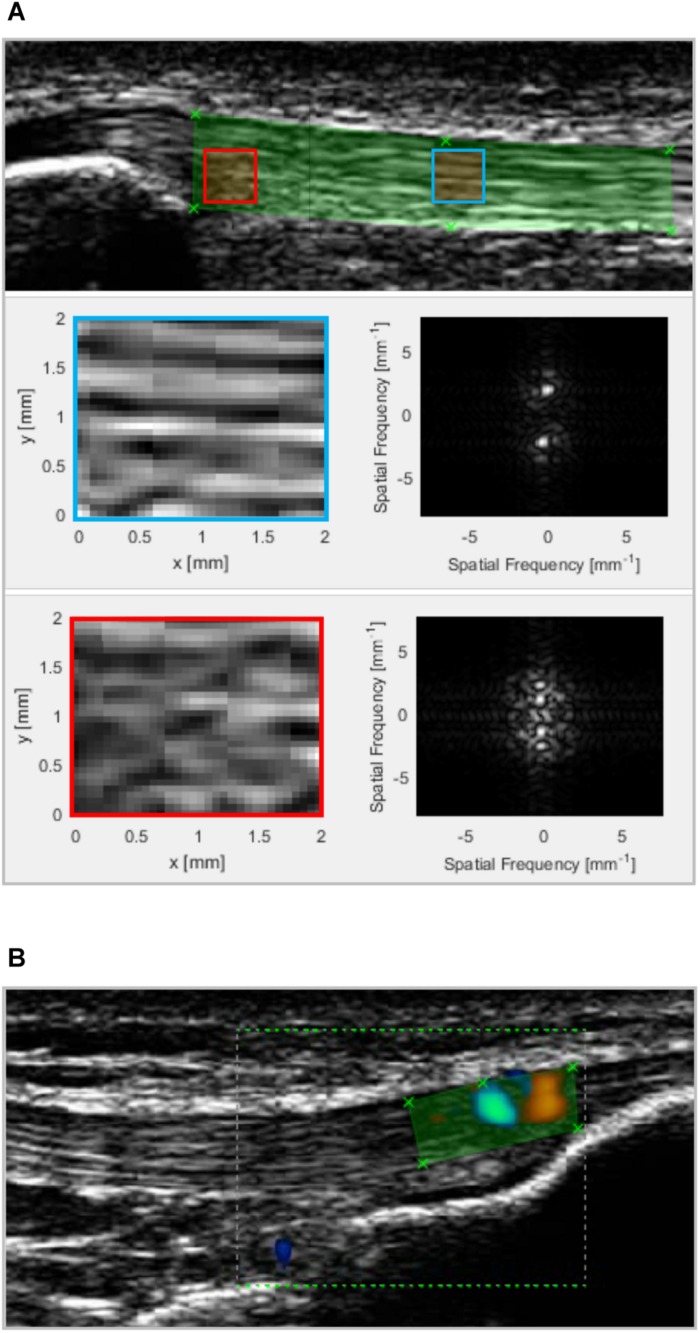
FIGURE 2.
(A) Patellar tendon micromorphology was assessed by applying a spatial frequency analysis on ultrasound images obtained from the proximal (shown) and distal tendon. All possible 32 × 32 pixel kernels within a polygonal region of interest (ROI; green) were filtered and 2D fast Fourier transformed. The blue and red squares represent two kernels with a high and low degree of fascicle packing and alignment and, thus, peak spatial frequency (2.2 and 1.4 mm–1, respectively). The panels on the right to the enlarged kernels show the respective frequency spectrum. The average PSF value of all kernels was used in the statistical analysis. (B) Vascularisation was quantified by measuring the color area within a polygonal ROI that covered all intratendinous color doppler signals (exemplary distal image shown).

