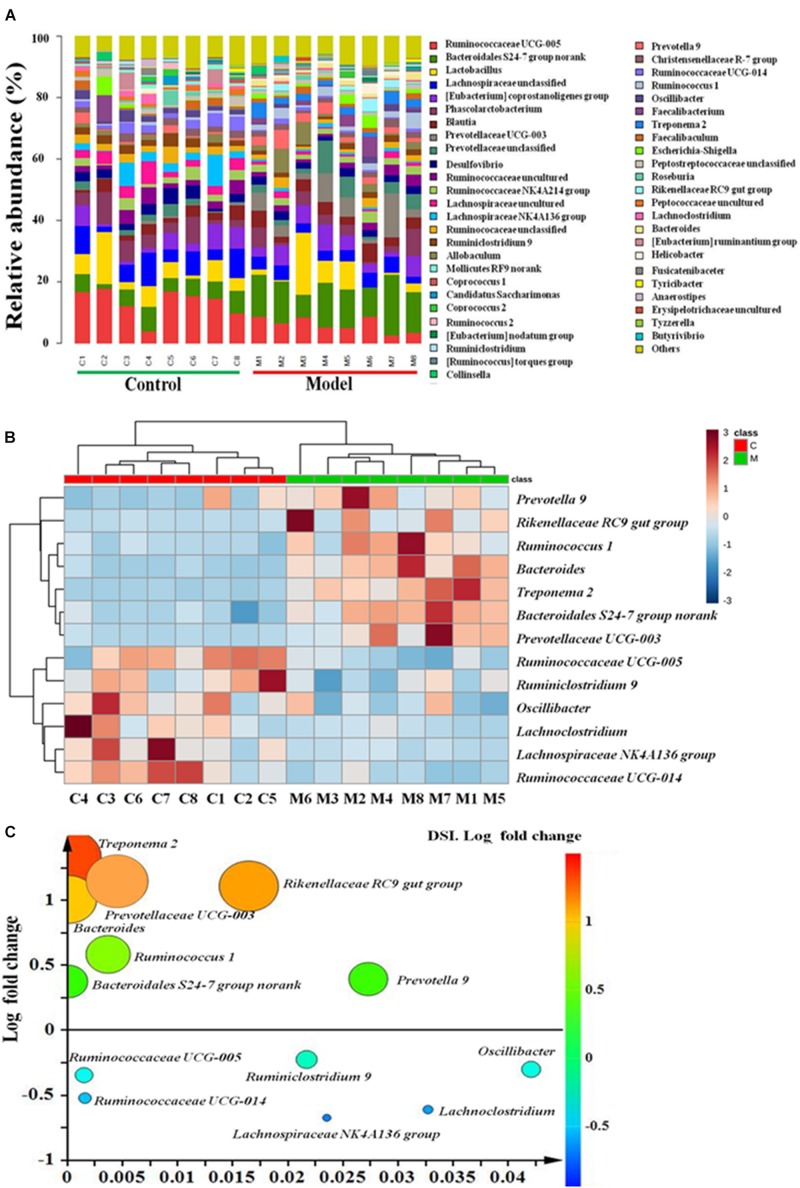
FIGURE 3.
The gut microbiota at genus level in ISO-induced AMI occurs strikingly changes. (A) Relative abundance of gut microbiota at genus level in model and control groups. (B) The heat map summarizing the thirteen altered genera in ISO-induced AMI and control groups. Red, high concentrations; white, medium concentrations; blue, low concentrations. (C) Fold changes and p-values of significant altered genera in cecal contents in ISO-induced AMI compared with control group.

